
Since last June, we noticed the database on GitLab.com would
mysteriously stall for minutes, which would lead to users seeing 500
errors during this time. Through a painstaking investigation over
several weeks, we finally uncovered the cause of this: initiating a
subtransaction via the SAVEPOINT SQL query while
a long transaction is in progress can wreak havoc on database
replicas. Thus launched a race, which we recently completed, to
eliminate all SAVEPOINT queries from our code. Here's what happened,
how we discovered the problem, and what we did to fix it.
自去年六月以来,我们注意到 GitLab.com 上的数据库会神秘地停顿数分钟,这会导致用户在此期间看到 500 错误。经过几周的艰苦调查,我们终于发现了原因:在进行长事务的同时,通过 SAVEPOINT SQL 查询启动一个子事务,可能会对数据库副本造成严重破坏。因此,我们开始了一场竞赛,最近我们完成了,从我们的代码中消除所有 SAVEPOINT 查询。以下是发生了什么,我们是如何发现问题的,以及我们是如何解决它的。
The symptoms begin 症状开始
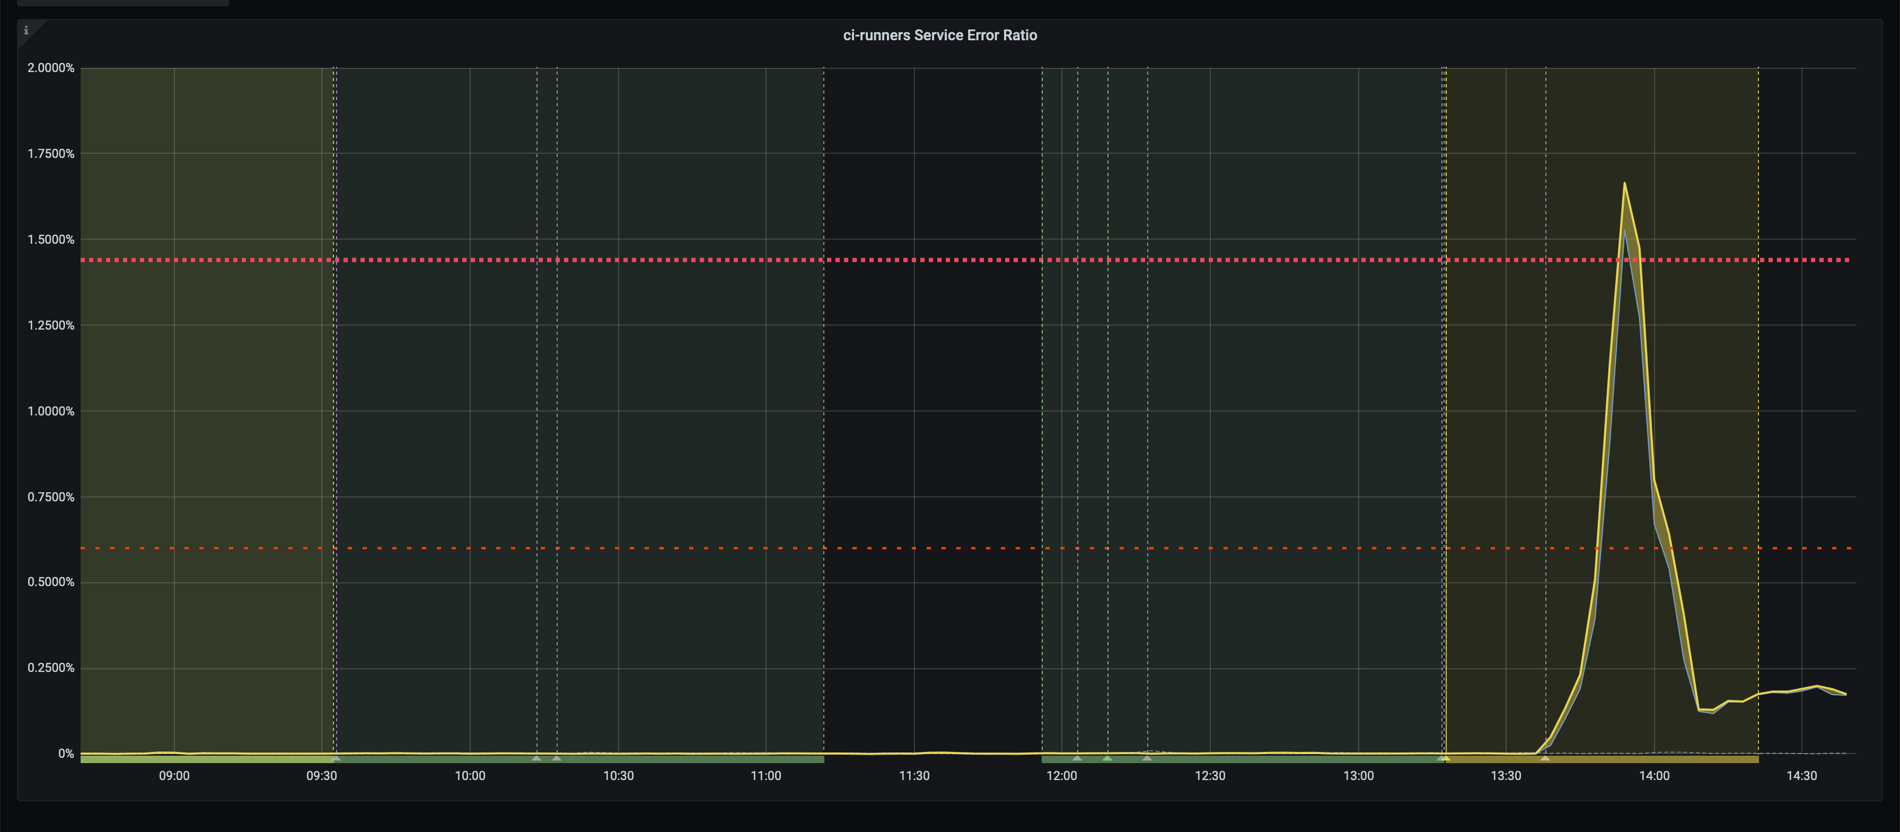
On June 24th, we noticed that our CI/CD runners service reported a high
error rate:
6 月 24 日,我们注意到我们的 CI/CD 运行器服务报告了高错误率:
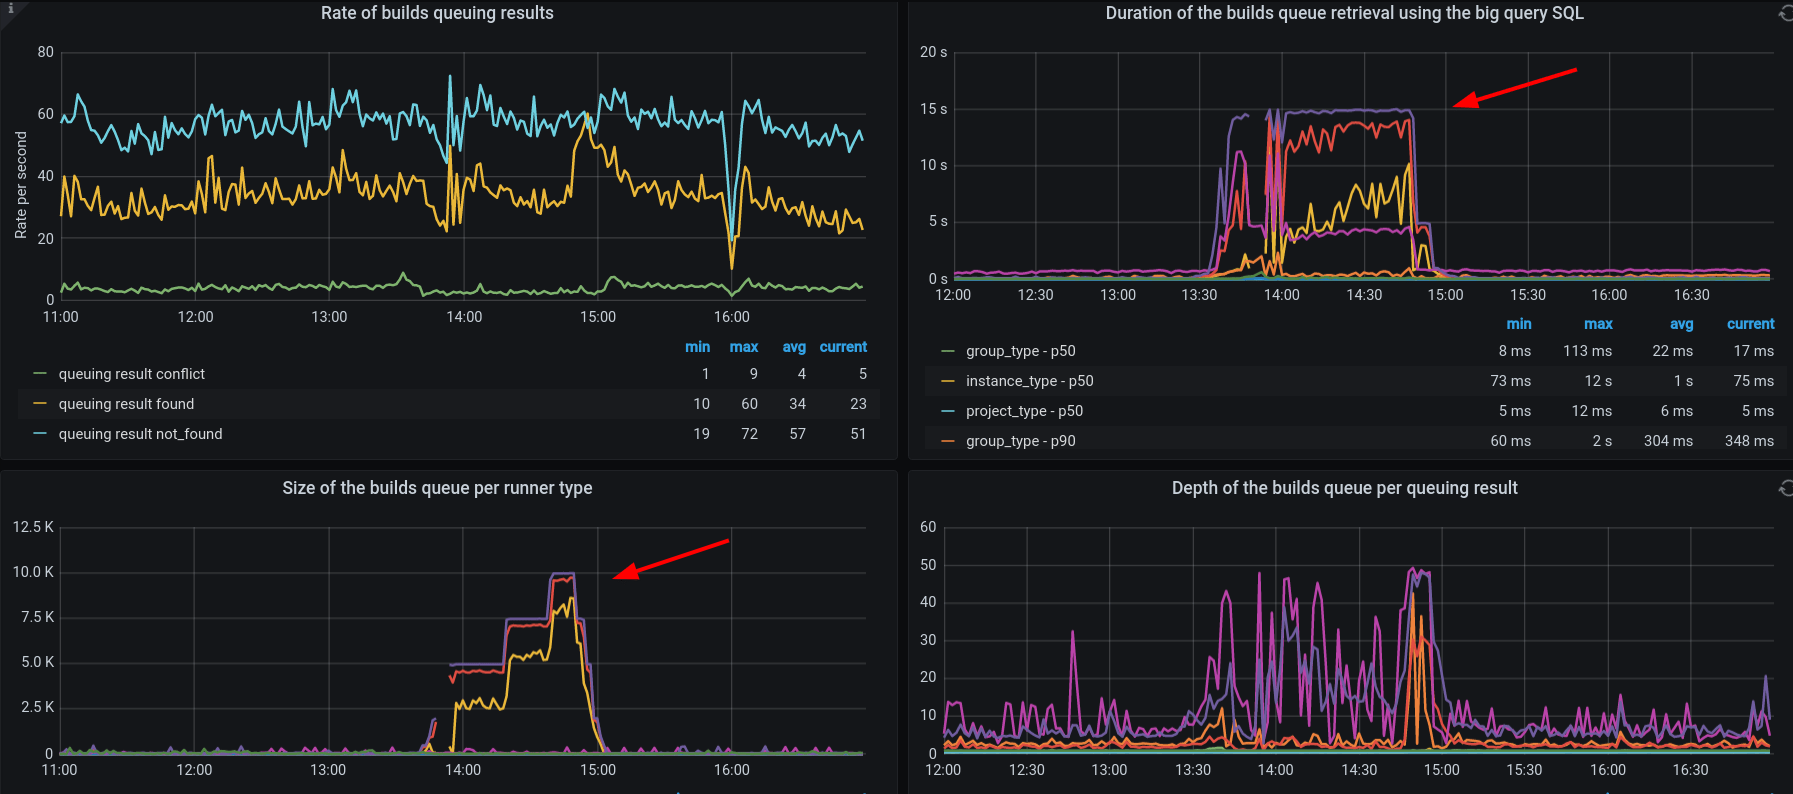
A quick investigation revealed that database queries used to retrieve
CI/CD builds data were timing out and that the unprocessed builds
backlog grew at a high rate:
快速调查显示,用于检索 CI/CD 构建数据的数据库查询超时,未处理的构建积压以高速增长:
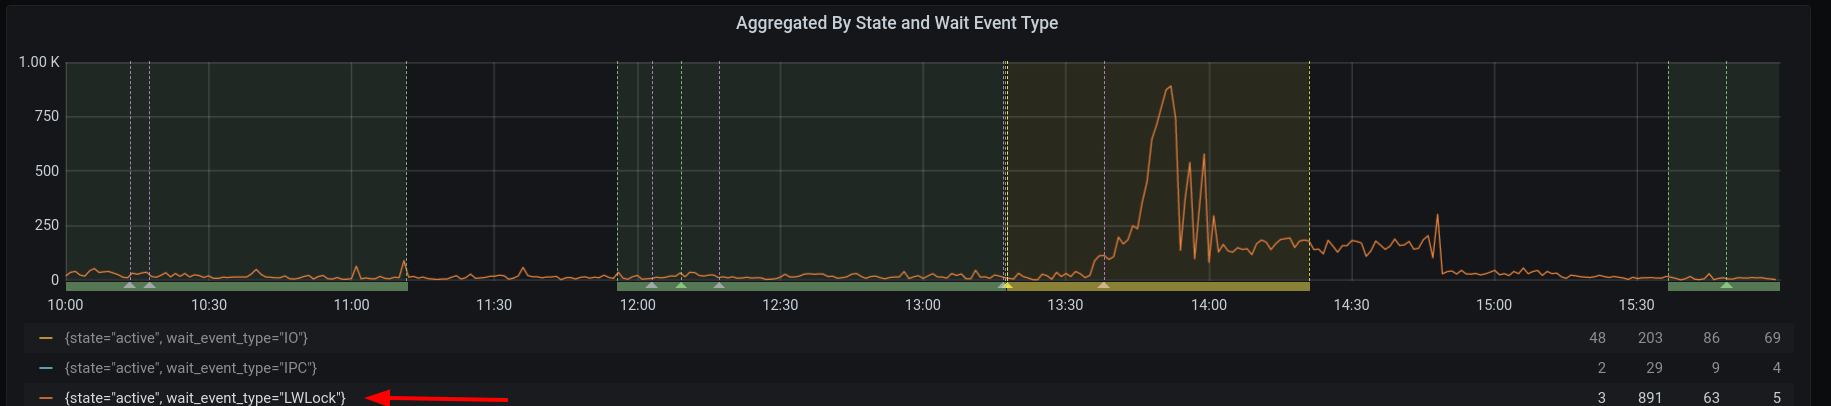
Our monitoring also showed that some of the SQL queries were waiting for
PostgreSQL lightweight locks (LWLocks):
我们的监控还显示,一些 SQL 查询正在等待 PostgreSQL 轻量级锁( LWLocks ):
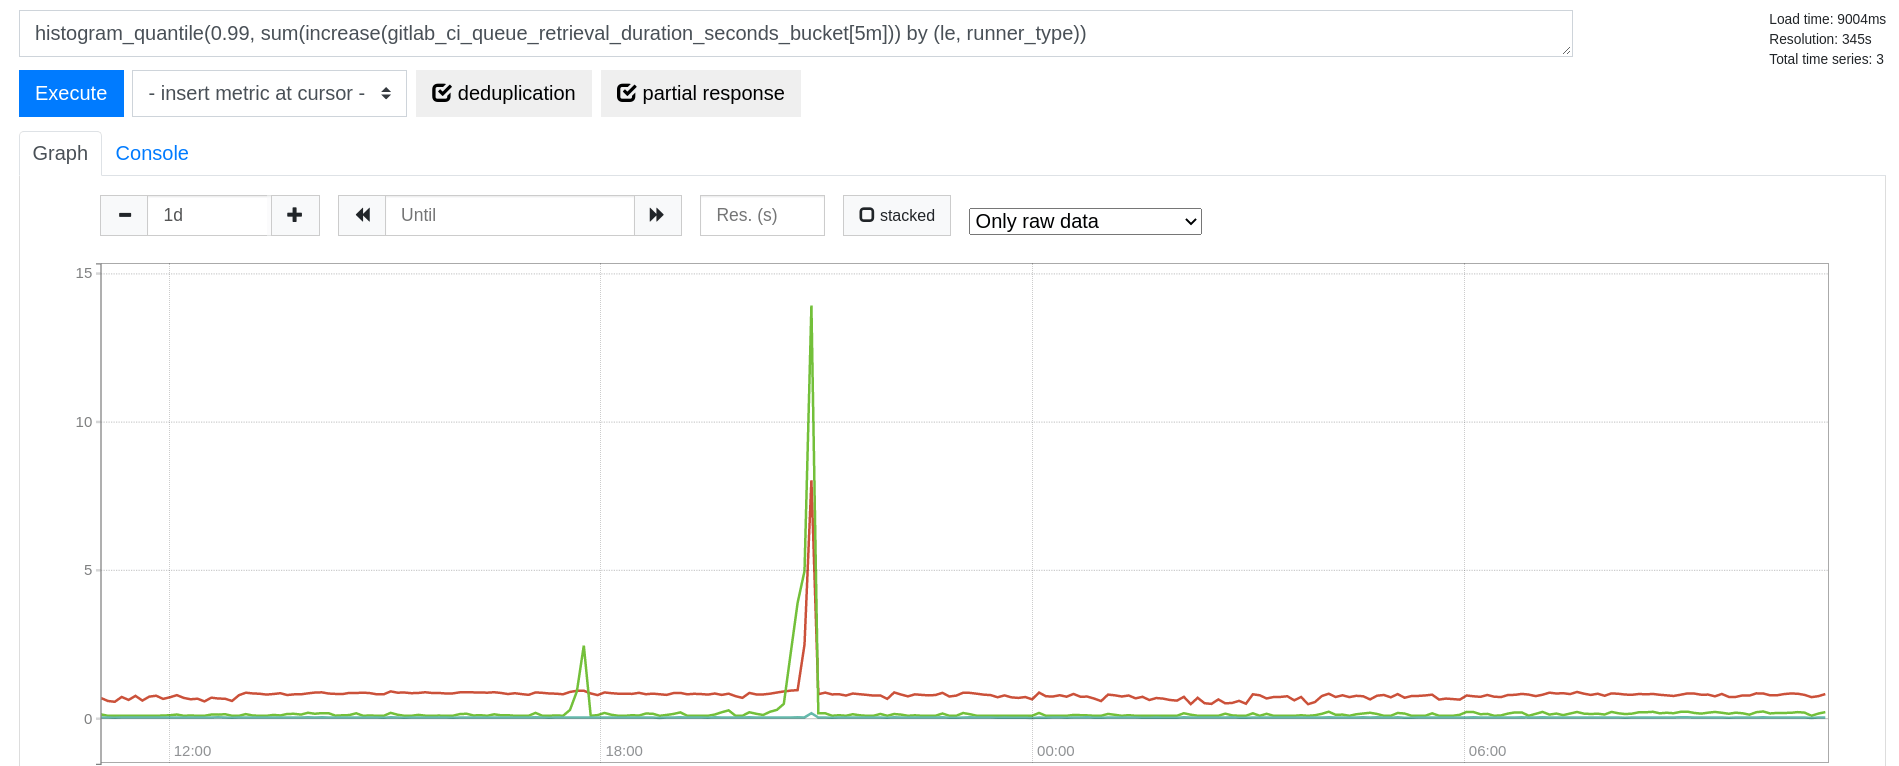
In the following weeks we had experienced a few incidents like this. We were
surprised to see how sudden these performance degradations were, and how
quickly things could go back to normal:
在接下来的几周里,我们经历了几起类似的事件。我们惊讶地发现这些性能下降是多么突然,以及事情能多快恢复正常:
Introducing Nessie: Stalled database queries
介绍 Nessie:数据库查询停滞
In order to learn more, we extended our observability tooling to sample
more data from pg_stat_activity. In PostgreSQL, the pg_stat_activity
virtual table contains the list of all database connections in the system as
well as what they are waiting for, such as a SQL query from the
client. We observed a consistent pattern: the queries were waiting on
SubtransControlLock. Below shows a graph of the URLs or jobs that were
stalled:
为了了解更多信息,我们扩展了我们的可观测性工具,从 pg_stat_activity 中采样更多数据。在 PostgreSQL 中, pg_stat_activity 虚拟表包含了系统中所有数据库连接的列表以及它们正在等待的内容,例如来自客户端的 SQL 查询。我们观察到一个一致的模式:查询正在等待 SubtransControlLock 。下面显示了被停滞的 URL 或作业的图表:
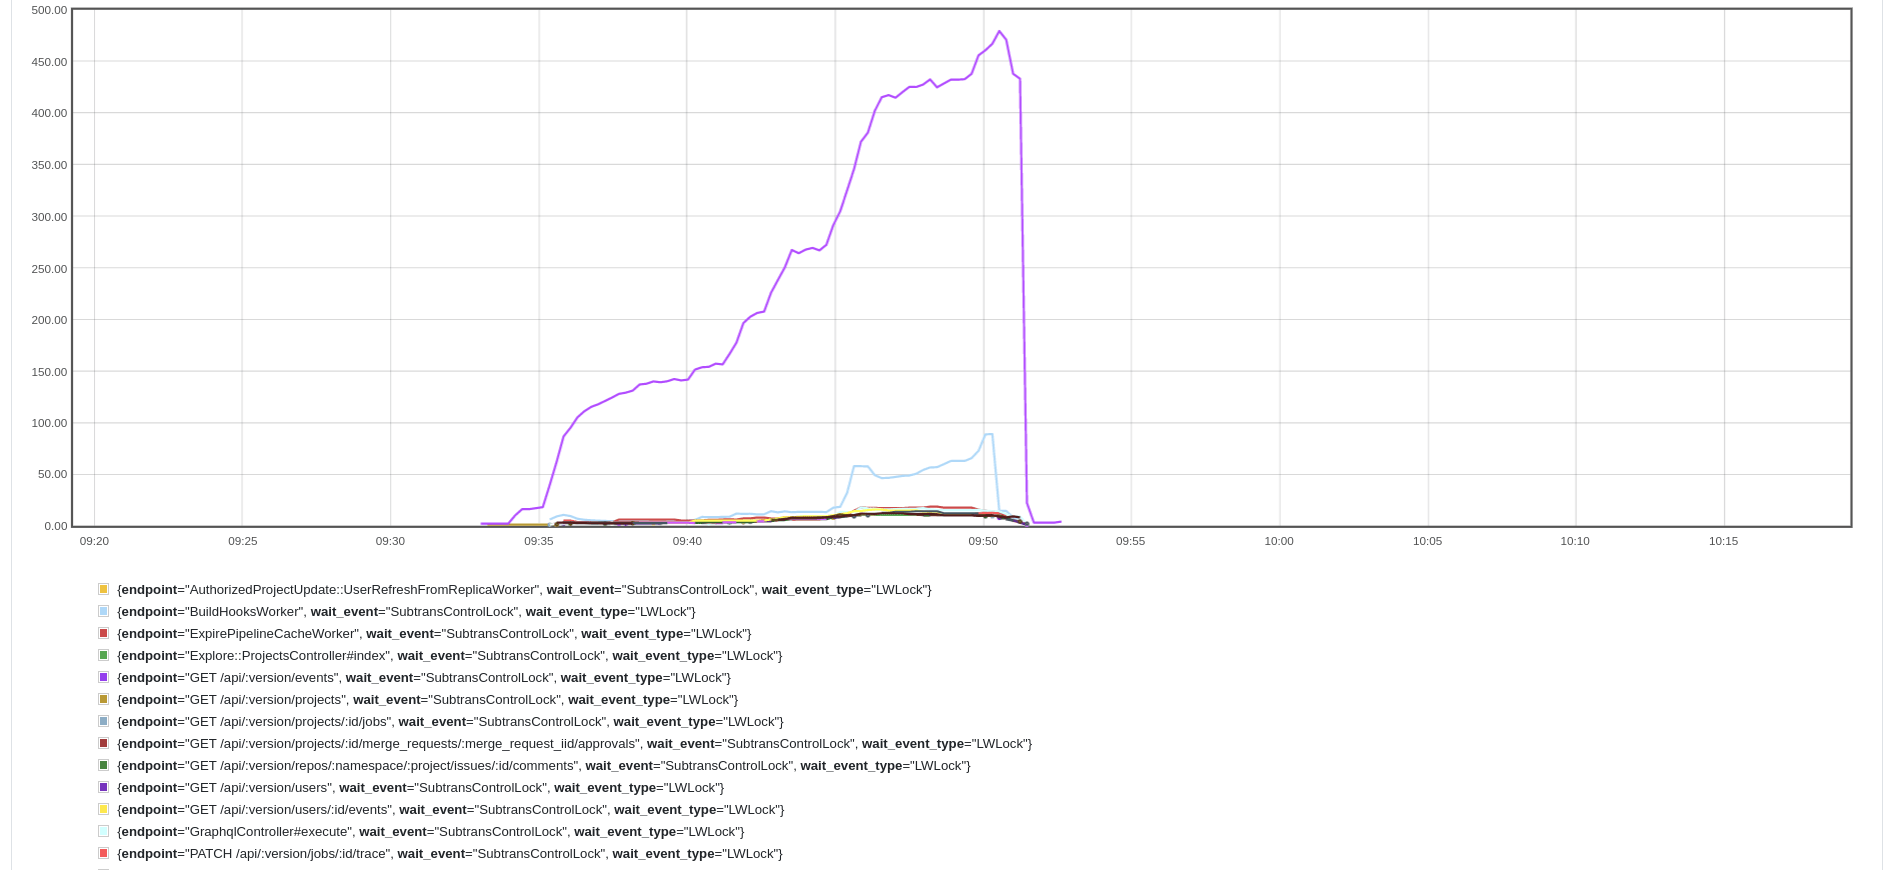
The purple line shows the sampled number of transactions locked by
SubtransControlLock for the POST /api/v4/jobs/request endpoint that
we use for internal communication between GitLab and GitLab Runners
processing CI/CD jobs.
紫色线条显示了被 SubtransControlLock 锁定的事务的采样数量,用于我们用于 GitLab 和 GitLab Runners 之间内部通信的 POST /api/v4/jobs/request 端点,处理 CI/CD 作业。
Although this endpoint was impacted the most, the whole database cluster
appeared to be affected as many other, unrelated queries timed out.
尽管这个端点受到的影响最大,但整个数据库集群似乎也受到了影响,因为许多其他无关的查询也超时了。
This same pattern would rear its head on random days. A week would pass
by without incident, and then it would show up for 15 minutes and
disappear for days. Were we chasing the Loch Ness Monster?
这种相同的模式会在随机的日子里突然出现。一周可能平安无事地过去,然后它会出现 15 分钟,又消失几天。我们是在追寻尼斯湖水怪吗?
Let's call these stalled queries Nessie for fun and profit.
让我们为了乐趣和利润,把这些停滞的查询称为尼斯。
What is a SAVEPOINT?
什么是 SAVEPOINT ?
To understand SubtransControlLock (PostgreSQL
13
renamed this to SubtransSLRU), we first must understand how
subtransactions work in PostgreSQL. In PostgreSQL, a transaction can
start via a BEGIN statement, and a subtransaction can be started with
a subsequent SAVEPOINT query. PostgreSQL assigns each of these a
transaction ID (XID for short) when a transaction or a subtransaction
needs one, usually before a client modifies data.
要理解 SubtransControlLock (PostgreSQL 13 将其重命名为 SubtransSLRU ),我们首先必须理解 PostgreSQL 中的子事务是如何工作的。在 PostgreSQL 中,可以通过一个 BEGIN 语句启动一个事务,而一个子事务可以通过随后的 SAVEPOINT 查询开始。PostgreSQL 在事务或子事务需要时会为它们分配一个事务 ID(简称 XID),通常是在客户端修改数据之前。
Why would you use a SAVEPOINT?
你为什么要使用 SAVEPOINT ?
For example, let's say you were running an online store and a customer
placed an order. Before the order is fullfilled, the system needs to
ensure a credit card account exists for that user. In Rails, a common
pattern is to start a transaction for the order and call
find_or_create_by. For
example:
例如,假设你正在运营一个在线商店,一个客户下了一个订单。在订单完成之前,系统需要确保该用户有一个信用卡账户。在 Rails 中,一个常见的模式是为订单开始一个事务并调用 find_or_create_by 。例如:
Order.transaction do
  begin
    CreditAccount.transaction(requires_new: true) do
      CreditAccount.find_or_create_by(customer_id: customer.id)
  rescue ActiveRecord::RecordNotUnique
    retry
  end
  # Fulfill the order
  # ...
end
If two orders were placed around the same time, you wouldn't want the
creation of a duplicate account to fail one of the orders. Instead, you
would want the system to say, "Oh, an account was just created; let me
use that."
如果两个订单几乎同时下达,你肯定不希望因为创建了重复账户而导致其中一个订单失败。相反,你会希望系统说:“哦,一个账户刚刚被创建了;让我使用那个。”
That's where subtransactions come in handy: the requires_new: true
tells Rails to start a new subtransaction if the application already is
in a transaction. The code above translates into several SQL calls that
look something like:
这就是子事务派上用场的地方: requires_new: true 告诉Rails如果应用程序已经在一个事务中,则开始一个新的子事务。上面的代码转换成几个看起来像这样的SQL调用:
--- Start a transaction
BEGIN
SAVEPOINT active_record_1
--- Look up the account
SELECT * FROM credit_accounts WHERE customer_id = 1
--- Insert the account; this may fail due to a duplicate constraint
INSERT INTO credit_accounts (customer_id) VALUES (1)
--- Abort this by rolling back
ROLLBACK TO active_record_1
--- Retry here: Start a new subtransaction
SAVEPOINT active_record_2
--- Find the newly-created account
SELECT * FROM credit_accounts WHERE customer_id = 1
--- Save the data
RELEASE SAVEPOINT active_record_2
COMMIT
On line 7 above, the INSERT might fail if the customer account was
already created, and the database unique constraint would prevent a
duplicate entry. Without the first SAVEPOINT and ROLLBACK block, the
whole transaction would have failed. With that subtransaction, the
transaction can retry gracefully and look up the existing account.
在上面的第7行,如果客户账户已经创建, INSERT 可能会失败,数据库唯一性约束将阻止重复条目的产生。如果没有第一个 SAVEPOINT 和 ROLLBACK 块,整个事务将会失败。有了那个子事务,事务可以优雅地重试并查找现有账户。
What is SubtransControlLock?
SubtransControlLock 是什么?
As we mentioned earlier, Nessie returned at random times with queries
waiting for SubtransControlLock. SubtransControlLock indicates that
the query is waiting for PostgreSQL to load subtransaction data from
disk into shared memory.
正如我们之前提到的,Nessie 在随机时间返回,等待 SubtransControlLock 的查询。 SubtransControlLock 表示查询正在等待 PostgreSQL 将子事务数据从磁盘加载到共享内存中。
Why is this data needed? When a client runs a SELECT, for example,
PostgreSQL needs to decide whether each version of a row, known as a
tuple, is actually visible within the current transaction. It's possible
that a tuple has been deleted or has yet to be committed by another
transaction. Since only a top-level transaction can actually commit
data, PostgreSQL needs to map a subtransaction ID (subXID) to its parent
XID.
为什么需要这些数据?例如,当客户端运行一个 SELECT 时,PostgreSQL 需要决定当前事务中每个版本的行(也称为元组)是否真正可见。可能有元组已被删除或尚未由另一个事务提交。由于只有顶级事务才能实际提交数据,PostgreSQL 需要将子事务 ID(subXID)映射到其父 XID。
This mapping of subXID to parent XID is stored on disk in the
pg_subtrans directory. Since reading from disk is slow, PostgreSQL
adds a simple least-recently used (SLRU) cache in front for each
backend process. The lookup is fast if the desired page is already
cached. However, as Laurenz Albe discussed in his blog
post,
PostgreSQL may need to read from disk if the number of active
subtransactions exceeds 64 in a given transaction, a condition
PostgreSQL terms suboverflow. Think of it as the feeling you might get
if you ate too many Subway sandwiches.
将subXID映射到父XID的信息存储在 pg_subtrans 目录中。由于从磁盘读取速度较慢,PostgreSQL为每个后端进程前面添加了一个简单的最近最少使用(SLRU)缓存。如果所需页面已经缓存,则查找速度很快。然而,正如Laurenz Albe在他的博客文章中讨论的,如果在给定事务中活跃的子事务数量超过64,PostgreSQL可能需要从磁盘读取,这种情况PostgreSQL称之为 suboverflow 。可以把它想象成你吃了太多Subway三明治后可能会有的感觉。
Suboverflowing (is that a word?) can bog down performance because as
Laurenz said, "Other transactions have to update pg_subtrans to
register subtransactions, and you can see in the perf output how they
vie for lightweight locks with the readers."
溢出子事务(这算是个词吗?)可能会拖慢性能,因为正如劳伦兹所说:“其他事务必须更新 pg_subtrans 来注册子事务,你可以在性能输出中看到它们如何与读取器争夺轻量级锁。”
Hunting for nested subtransactions
寻找嵌套子事务
Laurenz's blog post suggested that we might be using too many
subtransactions in one transaction. At first, we suspected we might be
doing this in some of our expensive background jobs, such as project
export or import. However, while we did see numerous SAVEPOINT calls
in these jobs, we didn't see an unusual degree of nesting in local
testing.
Laurenz 的博客文章暗示我们可能在一个事务中使用了太多子事务。起初,我们怀疑我们可能在一些耗费资源的后台作业中这样做,例如项目导出或导入。然而,尽管我们确实在这些作业中看到了许多 SAVEPOINT 调用,但在本地测试中我们并没有看到不寻常的嵌套程度。
To isolate the cause, we started by adding Prometheus metrics to track
subtransactions as a Prometheus metric by model.
This led to nice graphs as the following:
为了隔离原因,我们开始通过模型添加 Prometheus 指标来跟踪子事务作为 Prometheus 指标。这导致了如下的漂亮图表:

While this was helpful in seeing the rate of subtransactions over time,
we didn't see any obvious spikes that occurred around the time of the
database stalls. Still, it was possible that suboverflow was happening.
虽然这有助于观察随时间变化的子事务率,但我们并没有看到在数据库停滞时出现的任何明显峰值。尽管如此,子溢出的情况仍然有可能发生。
To see if that was happening, we instrumented our application to track
subtransactions and log a message whenever we detected more than 32
SAVEPOINT calls in a given transaction. Rails
makes it possible for the application to subscribe to all of its SQL
queries via ActiveSupport notifications. Our instrumentation looked
something like this, simplified for the purposes of discussion:
为了查看是否发生了这种情况,我们对我们的应用程序进行了检测,以跟踪子事务,并在我们检测到在给定事务中有超过32个 SAVEPOINT 调用时记录一条消息。Rails允许应用程序通过 ActiveSupport 通知订阅其所有的SQL查询。我们的检测工具看起来是这样的,为了讨论的目的进行了简化:
ActiveSupport::Notifications.subscribe('sql.active_record') do |event|
  sql = event.payload.dig(:sql).to_s
  connection = event.payload[:connection]
  manager = connection&.transaction_manager

  context = manager.transaction_context
  return if context.nil?

  if sql.start_with?('BEGIN')
    context.set_depth(0)
  elsif cmd.start_with?('SAVEPOINT', 'EXCEPTION')
    context.increment_savepoints
  elsif cmd.start_with?('ROLLBACK TO SAVEPOINT')
    context.increment_rollbacks
  elsif cmd.start_with?('RELEASE SAVEPOINT')
    context.increment_releases
  elsif sql.start_with?('COMMIT', 'ROLLBACK')
    context.finish_transaction
  end
end
This code looks for the key SQL commands that initiate transactions and
subtransactions and increments counters when they occurred. After a
COMMIT, we log a JSON message that contained the backtrace and the
number of SAVEPOINT and RELEASES calls. For example:
此代码查找启动事务和子事务的关键SQL命令,并在它们发生时增加计数器。在 COMMIT, 之后,我们记录了一个包含回溯和 SAVEPOINT 与 RELEASES 调用次数的JSON消息。例如:
{
  "sql": "/*application:web,correlation_id:01FEBFH1YTMSFEEHS57FA8C6JX,endpoint_id:POST /api/:version/projects/:id/merge_requests/:merge_request_iid/approve*/ BEGIN",
  "savepoints_count": 1,
  "savepoint_backtraces": [
    [
      "app/models/application_record.rb:75:in `block in safe_find_or_create_by'",
      "app/models/application_record.rb:75:in `safe_find_or_create_by'",
      "app/models/merge_request.rb:1859:in `ensure_metrics'",
      "ee/lib/analytics/merge_request_metrics_refresh.rb:11:in `block in execute'",
      "ee/lib/analytics/merge_request_metrics_refresh.rb:10:in `each'",
      "ee/lib/analytics/merge_request_metrics_refresh.rb:10:in `execute'",
      "ee/app/services/ee/merge_requests/approval_service.rb:57:in `calculate_approvals_metrics'",
      "ee/app/services/ee/merge_requests/approval_service.rb:45:in `block in create_event'",
      "ee/app/services/ee/merge_requests/approval_service.rb:43:in `create_event'",
      "app/services/merge_requests/approval_service.rb:13:in `execute'",
      "ee/app/services/ee/merge_requests/approval_service.rb:14:in `execute'",
      "lib/api/merge_request_approvals.rb:58:in `block (3 levels) in <class:MergeRequestApprovals>'",
    ]
  "rollbacks_count": 0,
  "releases_count": 1
}
This log message contains not only the number of subtransactions via
savepoints_count, but it also contains a handy backtrace that
identifies the exact source of the problem. The sql field also
contains Marginalia comments
that we tack onto every SQL query. These comments make it possible to
identify what HTTP request initiated the SQL query.
此日志消息不仅包含通过 savepoints_count 的子事务数量,而且还包含一个方便的回溯跟踪,用于识别问题的确切来源。字段 sql 还包含我们附加到每个SQL查询上的边注评论。这些评论使得能够识别是哪个HTTP请求启动了SQL查询。
Taking a hard look at PostgreSQL
认真审视 PostgreSQL
The new instrumentation showed that while the application regularly used
subtransactions, it never exceeded 10 nested SAVEPOINT calls.
新的监测工具显示,尽管应用程序经常使用子事务,但它从未超过 10 个嵌套的 SAVEPOINT 调用。
Meanwhile, Nikolay Samokhvalov, founder
of Postgres.ai, performed a battery of tests trying to replicate the problem.
He replicated Laurenz's results when a single transaction exceeded 64
subtransactions, but that wasn't happening here.
与此同时,Postgres.ai 的创始人 Nikolay Samokhvalov 进行了一系列测试,试图复制这个问题。当单个事务超过 64 个子事务时,他复制了 Laurenz 的结果,但这里并没有发生这种情况。
When the database stalls occurred, we observed a number of patterns:
当数据库出现停滞时,我们观察到了一些模式:
- Only the replicas were affected; the primary remained unaffected.
只有副本受到影响;主库保持正常。 - There was a long-running transaction, usually relating to
PostgreSQL's autovacuuming, during the time. The stalls stopped quickly after the transaction ended.
在此期间,存在一个长时间运行的事务,通常与 PostgreSQL 的自动清理有关。事务结束后,停滞很快停止了。
Why would this matter? Analyzing the PostgreSQL source code, Senior
Support Engineer Catalin Irimie posed an
intriguing question that led to a breakthrough in our understanding:
这为什么重要?在分析 PostgreSQL 源代码时,高级支持工程师 Catalin Irimie 提出了一个引人入胜的问题,这个问题导致了我们对此的理解有了突破性的进展:
Does this mean that, having subtransactions spanning more than 32 cache pages, concurrently, would trigger the exclusive SubtransControlLock because we still end up reading them from the disk?
这是否意味着,如果有超过 32 个缓存页面的子事务同时存在,就会因为我们仍然需要从磁盘读取它们而触发独占的 SubtransControlLock?
Reproducing the problem with replicas
复现副本中的问题
To answer this, Nikolay immediately modified his test to involve replicas and long-running transactions. Within a day, he reproduced the problem:
为了回答这个问题,尼古拉立即修改了他的测试,使其涉及副本和长时间运行的事务。不到一天,他就复现了这个问题:

The image above shows that transaction rates remain steady around
360,000 transactions per second (TPS). Everything was proceeding fine
until the long-running transaction started on the primary. Then suddenly
the transaction rates plummeted to 50,000 TPS on the replicas. Canceling
the long transaction immediately caused the transaction rate to return.
上图显示交易率保持在每秒大约360,000笔交易(TPS)的稳定水平。一切都进行得很顺利,直到主数据库上开始了一个长时间运行的交易。然后突然间,副本上的交易率骤降至每秒50,000笔交易。取消长时间运行的交易立即使交易率恢复。
What is going on here?
这里发生了什么?
In his blog post, Nikolay called the problem Subtrans SLRU overflow.
In a busy database, it's possible for the size of the subtransaction log
to grow so large that the working set no longer fits into memory. This
results in a lot of cache misses, which in turn causes a high amount of
disk I/O and CPU as PostgreSQL furiously tries to load data from disk to
keep up with all the lookups.
在他的博客文章中,尼古拉称这个问题为 Subtrans SLRU 溢出。在一个繁忙的数据库中,子事务日志的大小可能会增长到如此之大,以至于工作集不再适合内存。这导致了大量的缓存未命中,进而导致了大量的磁盘 I/O 和 CPU 使用,因为 PostgreSQL 疯狂地尝试从磁盘加载数据以跟上所有的查找。
As mentioned earlier, the subtransaction cache holds a mapping of the
subXID to the parent XID. When PostgreSQL needs to look up the subXID,
it calculates in which memory page this ID would live, and then does a
linear search to find in the memory page. If the page is not in the
cache, it evicts one page and loads the desired one into memory. The
diagram below shows the memory layout of the subtransaction SLRU.
如前所述,子事务缓存保存了子 XID 到父 XID 的映射。当 PostgreSQL 需要查找子 XID 时,它会计算这个 ID 会存在于哪一个内存页面中,然后进行线性搜索以在内存页面中找到它。如果页面不在缓存中,它会逐出一个页面并将所需的页面加载到内存中。下面的图表显示了子事务 SLRU 的内存布局。

By default, each SLRU page is an 8K buffer holding 4-byte parent
XIDs. This means 8192/4 = 2048 transaction IDs can be stored in each
page.
默认情况下,每个 SLRU 页面是一个 8K 缓冲区,用于存放 4 字节的父 XIDs。这意味着每个页面可以存储 8192/4 = 2048 个事务 ID。
Note that there may be gaps in each page. PostgreSQL will cache XIDs as
needed, so a single XID can occupy an entire page.
请注意,每个页面中可能会有间隙。PostgreSQL 将根据需要缓存 XIDs,因此一个单独的 XID 可以占用整个页面。
There are 32 (NUM_SUBTRANS_BUFFERS) pages, which means up to 65K
transaction IDs can be stored in memory. Nikolay demonstrated that in a
busy system, it took about 18 seconds to fill up all 65K entries. Then
performance dropped off a cliff, making the database replicas unusable.
有 32 ( NUM_SUBTRANS_BUFFERS ) 个页面,这意味着最多可以在内存中存储 65K 个事务 ID。Nikolay 展示了在一个繁忙的系统中,填满所有 65K 项大约需要 18 秒。然后性能急剧下降,使得数据库副本无法使用。
To our surprise, our experiments also demonstrated that a single
SAVEPOINT during a long-transaction could initiate this problem if
many writes also occurred simultaneously. That
is, it wasn't enough just to reduce the frequency of SAVEPOINT; we had
to eliminate them completely.
让我们惊讶的是,我们的实验还表明,在长事务中,如果同时发生了许多写操作,单个 SAVEPOINT 就能引发这个问题。也就是说,仅仅减少 SAVEPOINT 的频率是不够的;我们必须完全消除它们。
Why does a single SAVEPOINT cause problems?
为什么单个 SAVEPOINT 会引起问题?
To answer this question, we need to understand what happens when a
SAVEPOINT occurs in one query while a long-running transaction is
running.
要回答这个问题,我们需要理解当一个 SAVEPOINT 在一个长时间运行的事务正在进行时发生在一个查询中时会发生什么。
We mentioned earlier that PostgreSQL needs to decide whether a given row
is visible to support a feature called multi-version concurrency control, or MVCC for
short. It does this by storing hidden columns, xmin and xmax, in
each tuple.
我们之前提到,为了支持一个叫做多版本并发控制的特性,或者简称 MVCC,PostgreSQL 需要决定给定行是否对用户可见。它通过在每个元组中存储隐藏列 xmin 和 xmax 来实现这一点。
xmin holds the XID of when the tuple was created, and xmax holds the
XID when it was marked as dead (0 if the row is still present). In
addition, at the beginning of a transaction, PostgreSQL records metadata
in a database snapshot. Among other items, this snapshot records the
oldest XID and the newest XID in its own xmin and xmax values.
xmin 保存了元组创建时的 XID,而 xmax 保存了它被标记为死亡的 XID(如果行仍然存在,则为 0)。此外,在事务开始时,PostgreSQL 会在数据库快照中记录元数据。在其他项目中,这个快照记录了它自己的 xmin 和 xmax 值中的最老 XID 和最新 XID。
This metadata helps PostgreSQL determine whether a tuple is visible.
For example, a committed XID that started before xmin is definitely
visible, while anything after xmax is invisible.
这些元数据帮助 PostgreSQL 确定一个元组是否可见。例如,一个在 xmin 之前开始的已提交 XID 肯定是可见的,而在 xmax 之后的任何事务都是不可见的。
What does this have to do with long transactions?
这与长事务有什么关系?
Long transactions are bad in general because they can tie up
connections, but they can cause a subtly different problem on a
replica. On the replica, a single SAVEPOINT during a long transaction
causes a snapshot to suboverflow. Remember that dragged down performance
in the case where we had more than 64 subtransactions.
一般来说,长事务是不好的,因为它们可以占用连接,但在副本上它们可能会引起一个微妙的不同问题。在副本上,长事务期间的单个 SAVEPOINT 会导致快照下溢。记住,在我们有超过 64 个子事务的情况下,性能下降了。
Fundamentally, the problem happens because a replica behaves differently
from a primary when creating snapshots and checking for tuple
visibility. The diagram below illustrates an example with some of the
data structures used in PostgreSQL:
从根本上讲,问题发生是因为副本在创建快照和检查元组可见性时的行为与主库不同。下面的图表举例说明了PostgreSQL中使用的一些数据结构:

On the top of this diagram, we can see the XIDs increase at the
beginning of a subtransaction: the INSERT after the BEGIN gets 1,
and the subsequent INSERT in SAVEPOINT gets 2. Another client comes
along and performs a INSERT and SELECT at XID 3.
在这个图表的顶部,我们可以看到在子事务开始时XIDs增加:在 BEGIN 之后的 INSERT 变为1,随后在 SAVEPOINT 中的 INSERT 变为2。另一个客户端加入并在XID 3处执行 INSERT 和 SELECT 。
On the primary, PostgreSQL stores the transactions in progress in a
shared memory segment. The process array (procarray) stores XID 1 with
the first connection, and the database also writes that information to
the pg_xact directory. XID 2 gets stored in the pg_subtrans
directory, mapped to its parent, XID 1.
在主服务器上,PostgreSQL 将正在进行的事务存储在一个共享内存段中。进程数组( procarray )在第一个连接时存储 XID 1,并且数据库也将该信息写入 pg_xact 目录。XID 2 被存储在 pg_subtrans 目录中,映射到其父事务 XID 1。
If a read happens on the primary, the snapshot generated contains xmin
as 1, and xmax as 3. txip holds a list of transactions in progress,
and subxip holds a list of subtransactions in progress.
如果在主服务器上发生读取操作,生成的快照包含 xmin 为 1, xmax 为 3。 txip 持有正在进行的事务列表, subxip 持有正在进行的子事务列表。
However, neither the procarray nor the snapshot are shared directly
with the replica. The replica receives all the data it needs from the
write-ahead log (WAL).
然而, procarray 和快照都不会直接与副本共享。副本从预写式日志(WAL)接收其需要的所有数据。
Playing the WAL back one entry at time, the replica populates a shared data
structure called KnownAssignedIds. It contains all the transactions in
progress on the primary. Since this structure can only hold a limited number of
IDs, a busy database with a lot of active subtransactions could easily fill
this buffer. PostgreSQL made a design choice to kick out all subXIDs from this
list and store them in the pg_subtrans directory.
When a snapshot is generated on the replica, notice how txip is
blank. A PostgreSQL replica treats all XIDs as though they are
subtransactions and throws them into the subxip bucket. That works
because if a XID has a parent XID, then it's a subtransaction. Otherwise, it's a normal transaction. The code comments
explain the rationale.
However, this means the snapshot is missing subXIDs, and that could be
bad for MVCC. To deal with that, the replica also updates lastOverflowedXID:
 * When we throw away subXIDs from KnownAssignedXids, we need to keep track of
 * that, similarly to tracking overflow of a PGPROC's subxids array.  We do
 * that by remembering the lastOverflowedXID, ie the last thrown-away subXID.
 * As long as that is within the range of interesting XIDs, we have to assume
 * that subXIDs are missing from snapshots.  (Note that subXID overflow occurs
 * on primary when 65th subXID arrives, whereas on standby it occurs when 64th
 * subXID arrives - that is not an error.)
What is this "range of interesting XIDs"? We can see this in the code below:
这个“有趣的 XID 范围”是什么?我们可以在下面的代码中看到:
if (TransactionIdPrecedesOrEquals(xmin, procArray->lastOverflowedXid))
    suboverflowed = true;
If lastOverflowedXid is smaller than our snapshot's xmin, it means
that all subtransactions have completed, so we don't need to check for
subtransactions. However, in our example:
如果 lastOverflowedXid 小于我们快照的 xmin ,这意味着所有子事务都已完成,因此我们不需要检查子事务。然而,在我们的例子中:
xminis 1 because of the transaction.
由于事务的原因,xmin是 1。lastOverflowXidis 2 because of theSAVEPOINT.
lastOverflowXid是 2 是因为SAVEPOINT。
This means suboverflowed is set to true here, which tells PostgreSQL
that whenever a XID needs to be checked, check to see if it has a parent
XID. Remember that this causes PostgreSQL to:
这意味着在这里将 suboverflowed 设置为 true ,这告诉 PostgreSQL 每当需要检查 XID 时,检查它是否有父 XID。记住,这会导致 PostgreSQL:
- Look up the subXID for the parent XID in the SLRU cache.
在 SLRU 缓存中查找父 XID 的 subXID。 - If this doesn't exist in the cache, fetch the data from
pg_trans.
如果缓存中不存在这个,就从pg_trans获取数据。
In a busy system, the requested XIDs could span an ever-growing range of
values, which could easily exhaust the 64K entries in the SLRU
cache. This range will continue to grow as long as the transaction runs;
the rate of increase depends on how many updates are happening on the
prmary. As soon as the transaction terminates, the suboverflowed state
gets set to false.
在一个繁忙的系统中,请求的 XIDs 可能会跨越一个不断增长的值范围,这很容易耗尽 SLRU 缓存中的 64K 条目。只要事务运行,这个范围就会继续增长;增长的速率取决于主库上发生了多少更新。一旦事务终止, suboverflowed 状态就会被设置为 false 。
In other words, we've replicated the same conditions as we saw with 64
subtransactions, only with a single SAVEPOINT and a long transaction.
换句话说,我们复制了与 64 个子事务相同的条件,只不过是用一个单独的 SAVEPOINT 和一个长事务。
What can we do about getting rid of Nessie?
我们怎么才能摆脱尼斯湖水怪?
There are three options:
有三种选择:
- Eliminate
SAVEPOINTcalls completely.
完全消除SAVEPOINT呼叫。 - Eliminate all long-running transactions.
消除所有长时间运行的事务。 - Apply Andrey Borodin's patches to PostgreSQL and increase the subtransaction cache.
应用 Andrey Borodin 的补丁到 PostgreSQL 并增加子事务缓存。
We chose the first option because most uses of subtransaction could be
removed fairly easily. There were a number of approaches we took:
我们选择了第一个选项,因为大多数使用子事务的情况可以相当容易地被移除。我们采取了多种方法:
- Perform updates outside of a subtransaction. Examples: 1, 2
在子事务之外执行更新。示例:1,2 - Rewrite a query to use a
INSERTor anUPDATEwith anON CONFLICTclause to deal with duplicate constraint violations. Examples: 1, 2, 3
重写查询,使用INSERT或UPDATE以及ON CONFLICT子句来处理重复约束违规。示例:1,2,3 - Live with a non-atomic
find_or_create_by. We used this approach sparingly. Example: 1
与非原子find_or_create_by共存。我们谨慎地使用这种方法。例如:1
In addition, we added an alert whenever the application used a a single SAVEPOINT:
此外,我们增加了一个警告,每当应用程序使用了一个单一的 SAVEPOINT :

This had the side benefit of flagging a minor bug.
这还附带了标记一个小错误的好处。
Why not eliminate all long-running transactions?
为什么不消除所有长时间运行的事务呢?
In our database, it wasn't practical to eliminate all long-running
transactions because we think many of them happened via database
autovacuuming,
but we're not able to reproduce this yet.
We are working on partitioning the tables and sharding the database, but this is a much more time-consuming problem
than removing all subtransactions.
在我们的数据库中,消除所有长时间运行的事务并不实际,因为我们认为其中许多是通过数据库自动清理程序发生的,但我们还无法复现这一点。我们正在进行表的分区和数据库的分片,但这是一个比移除所有子事务更耗时的问题。
What about the PostgreSQL patches?
PostgreSQL 补丁怎么样?
Although we tested Andrey's PostgreSQL patches, we did not feel comfortable
deviating from the official PostgreSQL releases. Plus, maintaining a
custom patched release over upgrades would add a significant maintenance
burden for our infrastructure team. Our self-managed customers would
also not benefit unless they used a patched database.
虽然我们测试了 Andrey 的 PostgreSQL 补丁,但我们不愿意偏离官方的 PostgreSQL 版本。此外,维护一个自定义补丁版本以适应升级将为我们的基础设施团队增加重大的维护负担。我们自行管理的客户也不会受益,除非他们使用了打了补丁的数据库。
Andrey's patches do two main things:
安德烈的补丁主要做了两件事:
- Allow administrators to change the SLRU size to any value.
允许管理员将 SLRU 大小更改为任意值。 - Adds an associative cache.
to make it performant to use a large cache value.
添加了一个关联缓存。以便使用大缓存值时能够保持高性能。
Remember that the SLRU cache does a linear search for the desired page. That works fine when there are only 32 pages to search, but if you increase the cache size to 100 MB the search becomes much more expensive. The associative cache makes the lookup fast by indexing pages with a bitmask and looking up the entry with offsets from the remaining bits. This mitigates the problem because a transaction would need to be several magnitudes longer to cause a problem.
Nikolay demonstrated that the SAVEPOINT problem disappeared as soon as
we increased the SLRU size to 100 MB with those patches. With a 100 MB
cache, PostgreSQL can cache 26.2 million IDs (104857600/4), far more
than the measely 65K.
These patches are currently awaiting review, but in our opinion they should be given high priority for PostgreSQL 15.
Conclusion 结论
Since removing all SAVEPOINT queries, we have not seen Nessie rear her
head again. If you are running PostgreSQL with read replicas, we
strongly recommend that you also remove all subtransactions until
further notice.
自从移除了所有 SAVEPOINT 查询后,我们再也没有看到 Nessie 出现。如果您正在运行带有读副本的 PostgreSQL,我们强烈建议您在进一步通知之前也移除所有子事务。
PostgreSQL is a fantastic database, and its well-commented code makes it
possible to understand its limitations under different configurations.
PostgreSQL 是一个出色的数据库,其代码注释详细,使得我们能够在不同配置下理解其局限性。
We would like to thank the GitLab community for bearing with us while we
iron out this production issue.
我们想感谢 GitLab 社区在我们解决这个生产问题时的耐心等待。
We are also grateful for the support from Nikolay
Samokhvalov and Catalin
Irimie, who contributed to understanding where our
Loch Ness Monster was hiding.
我们也感谢 Nikolay Samokhvalov 和 Catalin Irimie 的支持,他们帮助我们找到了隐藏的尼斯湖水怪。
Cover image by Khadi Ganiev on iStock, licensed under standard license
封面图片由 iStock 的 Khadi Ganiev 提供,根据标准许可证授权

