%20–%20A%20Step-by-step%20Guide)
676872 total views
676872 lượt xem tổng cộng, 15 views today
Last Updated on April 4, 2023
Cập nhật lần cuối vào ngày 4 tháng 4 năm 2023
This article has been updated for Pine Script V5.
Bài viết này đã được cập nhật cho Pine Script V5.
Table of Contents Mục lục
- What is Pine script?
Pine script là gì? - Why should I use Pine script?
Tại sao tôi nên sử dụng Pine script? - Why shouldn’t I use Pine script?
Tại sao tôi không nên sử dụng Pine script? - What are the alternatives to using Pine script?
Có những lựa chọn nào thay thế cho việc sử dụng Pine script? - How do I get started with Pine script?
Làm thế nào để tôi bắt đầu với Pine script? - How to retrieve the price of Apple in Pine script?
Làm thế nào để lấy giá của Apple trong Pine script? - How to retrieve the SMA(20) of Apple in Pine script?
Làm thế nào để lấy SMA(20) của Apple trong Pine script? - How to backtest a moving average cross strategy with Pine Script?
Làm thế nào để kiểm tra lại một chiến lược giao cắt trung bình động bằng Pine Script? - How to set take profits and stop losses?
Cách thiết lập chốt lời và cắt lỗ? - How to fire a trade on Apple when Google moves 5%?
Cách thực hiện giao dịch trên Apple khi Google di chuyển 5%? - How to modify our scripts without coding?
Làm thế nào để chỉnh sửa các kịch bản của chúng tôi mà không cần lập trình? - How to Plot with Pine script?
Cách vẽ với Pine script? - How can I create a custom indicator with Pine script?
Làm thế nào tôi có thể tạo một chỉ báo tùy chỉnh bằng Pine script? - Final Thoughts Suy nghĩ cuối cùng

What is the Pine script?
Pine script là gì?
Pine script is a programming language created by TradingView to backtest trading strategies and create custom indicators.
Pine script là một ngôn ngữ lập trình được tạo ra bởi TradingView để kiểm tra lại các chiến lược giao dịch và tạo ra các chỉ báo tùy chỉnh.
Pine script was designed to be lightweight, and in most cases, you can achieve your objectives with fewer lines of code compared to other programming languages.
Pine script được thiết kế để nhẹ, và trong hầu hết các trường hợp, bạn có thể đạt được mục tiêu của mình với ít dòng mã hơn so với các ngôn ngữ lập trình khác.
It is not based on any particular language, but if you’ve used Python, you’ll tend to pick it up quickly and notice similarities.
Nó không dựa trên bất kỳ ngôn ngữ cụ thể nào, nhưng nếu bạn đã sử dụng Python, bạn sẽ có xu hướng tiếp thu nhanh chóng và nhận thấy những điểm tương đồng.
Pine script code can be created within Pine editor which is a part of TradingView’s online charting platform.
Mã Pine script có thể được tạo ra trong trình chỉnh sửa Pine, là một phần của nền tảng biểu đồ trực tuyến của TradingView.
Link: https://www.tradingview.com/pine-script-docs/en/v5/Introduction.html
Why should I use Pine script?
Tại sao tôi nên sử dụng Pine script?
Built-in Data – This is a big one. Testing strategies or creating indicators in other languages involves sourcing your own data.
Dữ liệu tích hợp sẵn – Đây là một vấn đề lớn. Các chiến lược kiểm tra hoặc tạo chỉ báo bằng các ngôn ngữ khác liên quan đến việc tìm nguồn dữ liệu của riêng bạn.
Not only does that mean you have to find a place to grab your data from, but you’ll also then have to format it in a certain way and this whole process can be time-consuming.
Không chỉ có nghĩa là bạn phải tìm một nơi để lấy dữ liệu của mình, mà bạn cũng sẽ phải định dạng nó theo một cách nhất định và toàn bộ quá trình này có thể tốn thời gian.
TradingView has a plethora of data available at your fingertips, ready to access with as little as one line of code.
TradingView có rất nhiều dữ liệu sẵn có ngay trong tầm tay bạn, sẵn sàng truy cập chỉ với một dòng mã.
Easy to Learn – Pine script syntax is readable and simpler than other programming languages.
Dễ học – Cú pháp Pine script dễ đọc và đơn giản hơn so với các ngôn ngữ lập trình khác.
Also, you don’t have to spend much time on error checking and handling as TradingView takes care of most of that for you.
Ngoài ra, bạn không cần phải dành nhiều thời gian cho việc kiểm tra và xử lý lỗi vì TradingView đã lo liệu hầu hết điều đó cho bạn.
Extensive user base and library – TradingView users have the option to publish their indicators and strategies to the TradingView library.
Cơ sở người dùng và thư viện rộng lớn – Người dùng TradingView có tùy chọn công bố các chỉ báo và chiến lược của họ lên thư viện TradingView.
Having access to open-source code is a great way to learn from other programmers. Also, in some cases, someone else may have already written the code for what you’re after.
Việc có quyền truy cập vào mã nguồn mở là một cách tuyệt vời để học hỏi từ các lập trình viên khác. Ngoài ra, trong một số trường hợp, có thể người khác đã viết mã cho những gì bạn đang tìm kiếm.
» Quantopian has shut down. An alternative to consider is QuantConnect.
» Quantopian đã ngừng hoạt động. Một lựa chọn thay thế để xem xét là QuantConnect.
QuantConnect is a browser-based backtesting and algo trading platform.
QuantConnect là một nền tảng kiểm tra lại và giao dịch thuật toán dựa trên trình duyệt.
Link: QuantConnect – A Complete Guide
Content Highlights:
Nội dung nổi bật:
- Create strategies based on alpha factors such as sentiment, crypto, corporate actions and macro data (data provided by QuantConnect).
Tạo chiến lược dựa trên các yếu tố alpha như tâm lý, tiền điện tử, hành động của công ty và dữ liệu vĩ mô (dữ liệu do QuantConnect cung cấp). - Backtest and trade a wide array of asset classes and industries ETFs (data provided by QuantConnect).
Kiểm tra lại và giao dịch một loạt các loại tài sản và quỹ ETF ngành (dữ liệu được cung cấp bởi QuantConnect). - License strategies to hedge fund (while you keep the IP) via QuantConnect’s Alpha Stream.
Chiến lược cấp phép cho quỹ đầu tư (trong khi bạn giữ quyền sở hữu trí tuệ) thông qua Alpha Stream của QuantConnect.
Why shouldn’t I use Pine script?
Tại sao tôi không nên sử dụng Pine script?
The main reason why you wouldn’t want to use Pine script is that you’re limited to the TradingView universe.
Lý do chính mà bạn không muốn sử dụng Pine script là bạn bị giới hạn trong vũ trụ TradingView.
Here are some specific limitations –
Dưới đây là một số hạn chế cụ thể –
Data – If TradingView does not offer the data you’re after, you’re out of luck.
Dữ liệu – Nếu TradingView không cung cấp dữ liệu bạn đang tìm kiếm, bạn sẽ không gặp may.
Granted, TradingView has a very comprehensive database of data feeds. But if your strategy involves trading obscure markets, price data may not be available.
Đúng vậy, TradingView có một cơ sở dữ liệu rất toàn diện về các nguồn dữ liệu. Nhưng nếu chiến lược của bạn liên quan đến việc giao dịch các thị trường ít được biết đến, dữ liệu giá có thể không có sẵn.
This extends outside of price data. Some strategies involve economic or statistical data. TradingView does offer some data (mainly Quandl data) in this category but it is limited at this time.
Điều này mở rộng ra ngoài dữ liệu giá. Một số chiến lược liên quan đến dữ liệu kinh tế hoặc thống kê. TradingView cung cấp một số dữ liệu (chủ yếu là dữ liệu Quandl) trong danh mục này nhưng hiện tại còn hạn chế.
If you use alternative data in your strategy, it’s probably easier to use another programming language that offers more flexibility.
Nếu bạn sử dụng dữ liệu thay thế trong chiến lược của mình, có lẽ dễ hơn nếu sử dụng một ngôn ngữ lập trình khác cung cấp nhiều tính linh hoạt hơn.
External libraries – Pine script is not appropriate if you’re looking to leverage external libraries to do things like Machine learning.
Thư viện bên ngoài – Pine script không phù hợp nếu bạn đang tìm cách tận dụng các thư viện bên ngoài để thực hiện các công việc như Học máy.
There are better alternatives if your strategy relies on using data science or other third-party libraries.
Có những lựa chọn tốt hơn nếu chiến lược của bạn dựa vào việc sử dụng khoa học dữ liệu hoặc các thư viện bên thứ ba khác.
» Check out how we use TradingView to visually find pairs to trade.
» Xem cách chúng tôi sử dụng TradingView để tìm các cặp giao dịch một cách trực quan.
Link: Pairs Trading – A Real-World Guide
Liên kết: Giao dịch cặp – Hướng dẫn thực tế
What are the alternatives to using Pine script?
Có những lựa chọn nào thay thế cho việc sử dụng Pine script?
TD Ameritrade’s thinkorswim – this platform has a lot of similarities to Pine Script.
TD Ameritrade’s thinkorswim – nền tảng này có nhiều điểm tương đồng với Pine Script.
It utilizes a proprietary language called thinkScript and stores price data in arrays in a similar way to Pine script.
Nó sử dụng một ngôn ngữ độc quyền gọi là thinkScript và lưu trữ dữ liệu giá trong các mảng theo cách tương tự như Pine script.
Data is built-in and the platform is geared toward creating custom indicators and strategies.
Dữ liệu được tích hợp sẵn và nền tảng được thiết kế để tạo ra các chỉ báo và chiến lược tùy chỉnh.
Ninjatrader – This platform also uses a proprietary language which is called Ninjascript. The language is not completely proprietary as it is based on C#.
Ninjatrader – Nền tảng này cũng sử dụng một ngôn ngữ độc quyền được gọi là Ninjascript. Ngôn ngữ này không hoàn toàn độc quyền vì nó dựa trên C#.
Ninjatrader has a bit more flexibility as it allows you to connect to custom data feeds.
Ninjatrader có một chút linh hoạt hơn vì nó cho phép bạn kết nối với các nguồn dữ liệu tùy chỉnh.
If you’re already familiar with C#, C, or C++, this might be a viable alternative.
Nếu bạn đã quen thuộc với C#, C hoặc C++, đây có thể là một lựa chọn khả thi.
How do I get started with Pine script?
Làm thế nào để tôi bắt đầu với Pine script?
Getting started with Pine script is really simple, there is nothing to download or install.
Bắt đầu với Pine script thật sự rất đơn giản, không có gì để tải về hoặc cài đặt.
If you already have an account with TradingView, simply head over to their page.
Nếu bạn đã có tài khoản với TradingView, chỉ cần truy cập vào trang của họ.
If you don’t have an account, navigate to www.tradingview.com. From there you will see a sign-in box in the upper right-hand corner.
Nếu bạn không có tài khoản, hãy truy cập www.tradingview.com. Từ đó, bạn sẽ thấy một hộp đăng nhập ở góc trên bên phải.
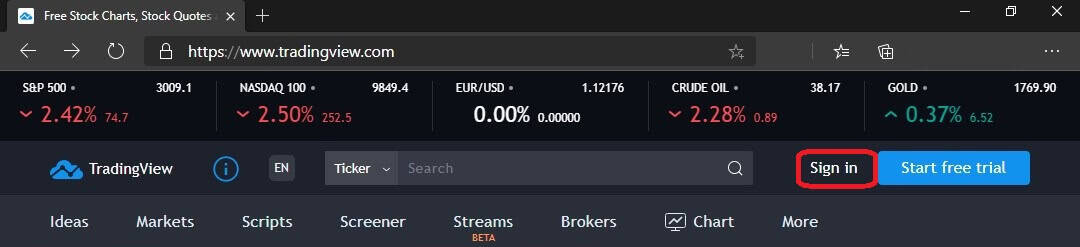
There are several one-click options to sign up, or use the traditional email/password method.
Có nhiều tùy chọn đăng ký chỉ với một cú nhấp chuột, hoặc sử dụng phương pháp truyền thống với email/mật khẩu.
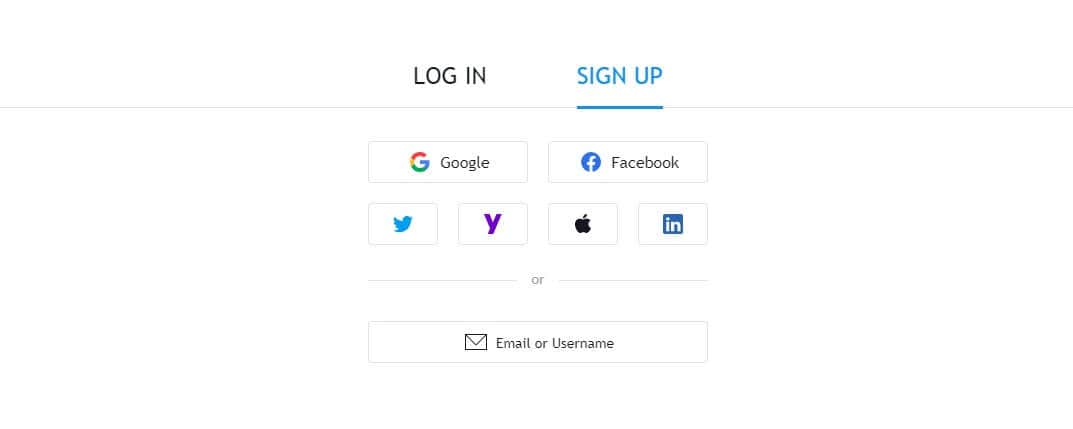
Having an account allows you to save your scripts to the TradingView cloud, and provides the ability to add custom indicators to your charts.
Việc có một tài khoản cho phép bạn lưu các kịch bản của mình lên đám mây TradingView và cung cấp khả năng thêm các chỉ báo tùy chỉnh vào biểu đồ của bạn.
Once signed up, launch the charting platform either by clicking on chart in the menu or by navigating to www.tradingview.com/chart
Sau khi đăng ký, hãy khởi động nền tảng biểu đồ bằng cách nhấp vào biểu đồ trong menu hoặc truy cập www.tradingview.com/chart
A first look at Pine editor
Một cái nhìn đầu tiên về trình soạn thảo Pine
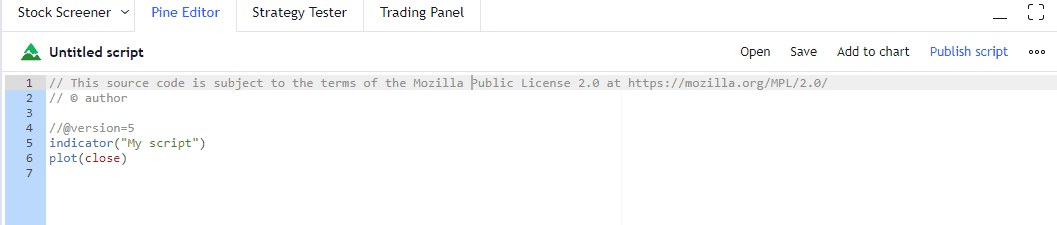
Pine editor is where we will be creating our code. To launch it, click on Pine Editor on the very bottom of your screen.
Trình chỉnh sửa Pine là nơi chúng ta sẽ tạo mã của mình. Để khởi động nó, hãy nhấp vào Trình chỉnh sửa Pine ở rất dưới cùng của màn hình.

A screen should pop up that looks like the image below.
Một màn hình sẽ xuất hiện trông giống như hình ảnh bên dưới.
In Pine script, you will either be creating an indicator or a strategy. We will discuss the differences extensively in this article.
Trong Pine script, bạn sẽ tạo ra một chỉ báo hoặc một chiến lược. Chúng ta sẽ thảo luận về những khác biệt một cách chi tiết trong bài viết này.
If you’re following along, the screen you’re looking at now is the default starting script to create an indicator.
Nếu bạn đang theo dõi, màn hình bạn đang nhìn bây giờ là kịch bản khởi động mặc định để tạo một chỉ báo.
Let’s run through it line by line.
Hãy cùng xem qua từng dòng.
// This source code is subject to the terms of the Mozilla Public License 2.0 at https://mozilla.org/MPL/2.0/The first line is simply a comment. Comments in Pine script start with two forward slashes.
Dòng đầu tiên chỉ là một chú thích. Các chú thích trong Pine script bắt đầu bằng hai dấu gạch chéo.
// © authorThe second line is also a comment, it is auto-populated with your TradingView user name.
Dòng thứ hai cũng là một bình luận, nó được tự động điền với tên người dùng TradingView của bạn.
//@version=5On the fourth line, you might assume we have yet another comment. However, this line is a bit different.
Trên dòng thứ tư, bạn có thể cho rằng chúng ta có một bình luận khác. Tuy nhiên, dòng này thì hơi khác một chút.
This is known as a compiler directive. It lets the compiler know which version of Pine script we want to use.
Đây được gọi là chỉ thị biên dịch. Nó cho phép trình biên dịch biết phiên bản nào của Pine script mà chúng ta muốn sử dụng.
You can forego the first two comment lines if you want, but the compiler directive is required in all scripts.
Bạn có thể bỏ qua hai dòng chú thích đầu tiên nếu bạn muốn, nhưng chỉ thị biên dịch là bắt buộc trong tất cả các tập lệnh.
indicator("My Script")Line 5 is a declaration. This is where you specify if you are creating an indicator.
Dòng 5 là một tuyên bố. Đây là nơi bạn chỉ định nếu bạn đang tạo một chỉ báo.
The alternative is to create a strategy, but we will start with the indicator.
Lựa chọn thay thế là tạo ra một chiến lược, nhưng chúng ta sẽ bắt đầu với chỉ báo.
The second part of Line 5, in quotation marks, is the name that we will assign for this particular indicator. The default is My Script.
Phần thứ hai của Dòng 5, trong dấu ngoặc kép, là tên mà chúng ta sẽ gán cho chỉ số cụ thể này. Mặc định là My Script.
plot(close)Line 6 contains the plot command. As you may have guessed, this tells TradingView to plot a specific variable.
Dòng 6 chứa lệnh vẽ. Như bạn có thể đoán, điều này cho TradingView biết để vẽ một biến cụ thể.
In this case, the variable close will get plotted. This is a built-in variable that contains the closing price of the latest bar.
Trong trường hợp này, biến close sẽ được vẽ. Đây là một biến tích hợp sẵn chứa giá đóng cửa của thanh gần nhất.
Let’s hit Add to Chart on the upper right of the Pine editor.
Hãy nhấn Thêm vào Biểu đồ ở góc trên bên phải của trình chỉnh sửa Pine.
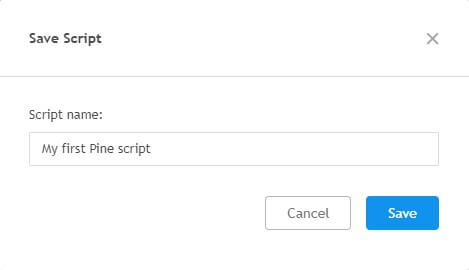
You will be prompted to save the script.
Bạn sẽ được nhắc lưu kịch bản.
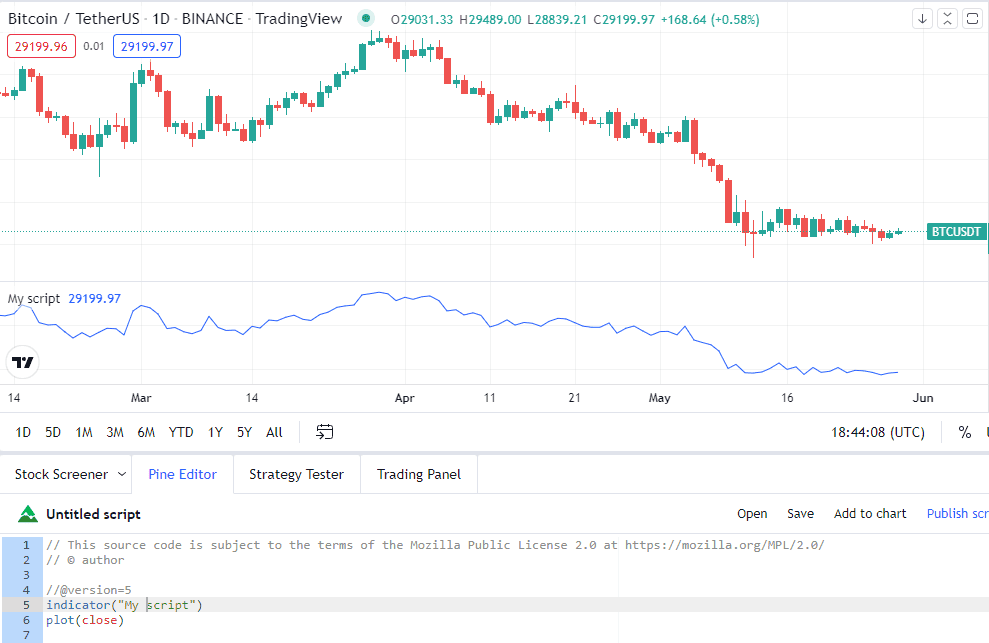
Once saved, your chart should have a new window that contains a plot of the closing prices from your main chart.
Khi đã lưu, biểu đồ của bạn sẽ có một cửa sổ mới chứa đồ thị giá đóng cửa từ biểu đồ chính của bạn.
This window is called the data window. In the image above, this is the line chart that is drawn in blue.
Cửa sổ này được gọi là cửa sổ dữ liệu. Trong hình trên, đây là biểu đồ đường được vẽ bằng màu xanh.
Note that the data window shows “My Script” in the upper left-hand corner. This pulls whatever is entered into Line 5 of our code where we declared a name for the indicator.
Lưu ý rằng cửa sổ dữ liệu hiển thị “My Script” ở góc trên bên trái. Điều này kéo bất cứ thứ gì được nhập vào Dòng 5 của mã của chúng tôi, nơi chúng tôi đã khai báo một tên cho chỉ báo.
And there you have it, our first indicator and we didn’t even need to write any code!
Và đó là nó, chỉ số đầu tiên của chúng ta và chúng ta thậm chí không cần phải viết bất kỳ mã nào!
How to retrieve the price of Apple?
Làm thế nào để lấy giá của Apple?
In our first example, we plotted the closing price. Pine script will automatically do that for whichever chart you have open.
Trong ví dụ đầu tiên của chúng tôi, chúng tôi đã vẽ giá đóng cửa. Pine script sẽ tự động làm điều đó cho bất kỳ biểu đồ nào bạn đang mở.
In this case, we had a daily chart of Bitcoin open.
Trong trường hợp này, chúng tôi đã có một biểu đồ hàng ngày của Bitcoin.
But what if you want to get data for another asset? Let’s go through an example where we grab the price of Apple even though we don’t have its chart open.
Nhưng nếu bạn muốn lấy dữ liệu cho một tài sản khác thì sao? Hãy cùng xem một ví dụ mà chúng ta lấy giá của Apple mặc dù chúng ta không mở biểu đồ của nó.
Every script will start with a few lines where we set the compiler directive. We also indicate if it’s an indicator or strategy that we are creating, and assign a name.
Mỗi kịch bản sẽ bắt đầu với một vài dòng nơi chúng ta thiết lập chỉ thị biên dịch. Chúng ta cũng chỉ ra nếu đó là một chỉ báo hoặc chiến lược mà chúng ta đang tạo ra, và gán một tên.
//@version=5
indicator("price of Apple")
In this case, we are creating an indicator. The name of this indicator is “price of Apple”.
Trong trường hợp này, chúng ta đang tạo ra một chỉ báo. Tên của chỉ báo này là “giá của Apple”.
Next, we have to tell Pine Script that we are interested in an asset other than what is currently displayed on the chart.
Tiếp theo, chúng ta phải cho Pine Script biết rằng chúng ta quan tâm đến một tài sản khác ngoài tài sản hiện đang hiển thị trên biểu đồ.
To do this, we can use the request.security() function.
Để làm điều này, chúng ta có thể sử dụng hàm request.security().
request.security()A nice feature of Pine script is that help is always easily available if you’re working with the syntax you haven’t worked with before.
Một tính năng tốt của Pine script là trợ giúp luôn dễ dàng có sẵn nếu bạn đang làm việc với cú pháp mà bạn chưa từng làm trước đây.
For example, we can hover over our function and it will show a brief description.
Ví dụ, chúng ta có thể di chuột qua hàm của mình và nó sẽ hiển thị một mô tả ngắn gọn.
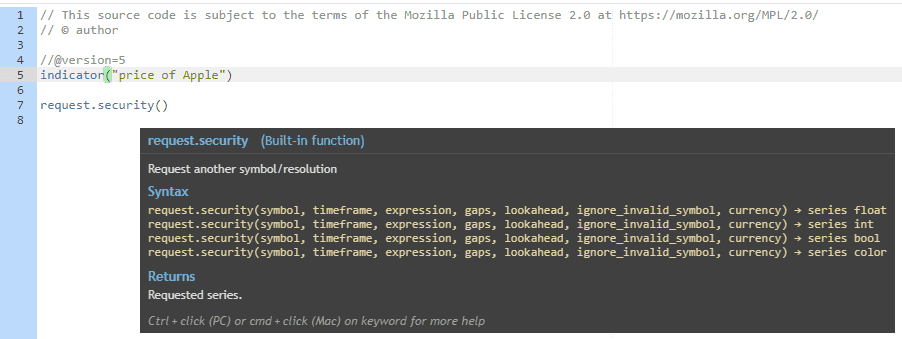
For more detailed information, you can launch a help window. To do this, hit CTRL while clicking on the function on a PC. Or, on a Mac, press CMD while clicking on the function.
Để biết thêm thông tin chi tiết, bạn có thể mở cửa sổ trợ giúp. Để làm điều này, nhấn CTRL trong khi nhấp vào chức năng trên máy tính PC. Hoặc, trên Mac, nhấn CMD trong khi nhấp vào chức năng.
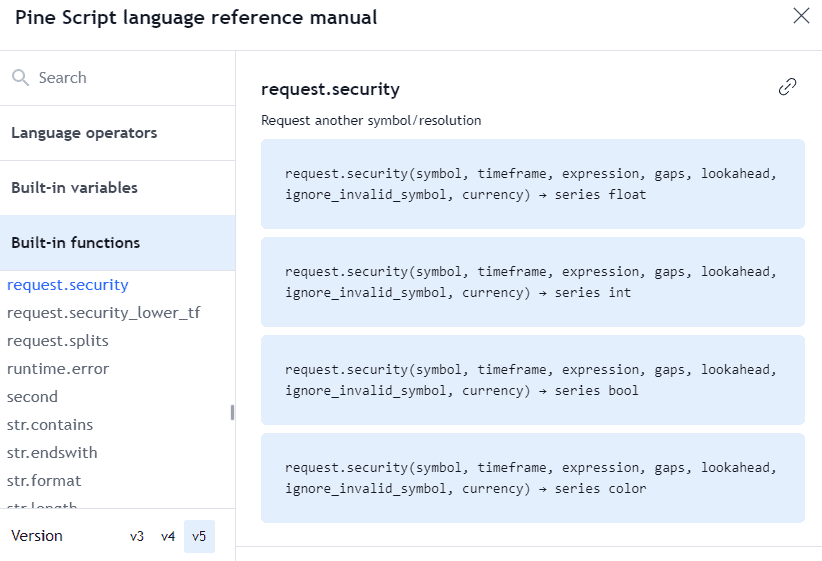
The help function clarifies the syntax and even has helpful examples.
Chức năng trợ giúp làm rõ cú pháp và thậm chí có những ví dụ hữu ích.
request.security("AAPL", "D", close)We’ve used syntax similar to the example in the above code snippet. The first value in the security function is the ticker symbol which is AAPL.
Chúng tôi đã sử dụng cú pháp tương tự như ví dụ trong đoạn mã trên. Giá trị đầu tiên trong hàm bảo mật là ký hiệu chứng khoán, đó là AAPL.
Then we set the time frame to daily. And lastly, we told Pine script we are interested in the closing price.
Sau đó, chúng tôi đặt khung thời gian thành hàng ngày. Cuối cùng, chúng tôi đã nói với Pine script rằng chúng tôi quan tâm đến giá đóng cửa.
We can save the return of the function to a variable.
Chúng ta có thể lưu giá trị trả về của hàm vào một biến.
apple_price = request.security("AAPL", "D", close)Now the apple_price variable will contain the latest daily close of Apple’s stock.
Bây giờ biến apple_price sẽ chứa giá đóng cửa hàng ngày mới nhất của cổ phiếu Apple.
Studies created in Pine script need to have at least one output, otherwise, the script will generate a compiler error.
Các nghiên cứu được tạo trong Pine script cần có ít nhất một đầu ra, nếu không, script sẽ tạo ra lỗi biên dịch.
Let’s plot our variable so that it satisfies the Pine script rule about having an output.
Hãy vẽ biến của chúng ta sao cho nó thỏa mãn quy tắc của Pine script về việc có một đầu ra.
plot(apple_price)After saving and adding to the chart, this is what our screen looks like.
Sau khi lưu và thêm vào biểu đồ, màn hình của chúng ta trông như thế này.
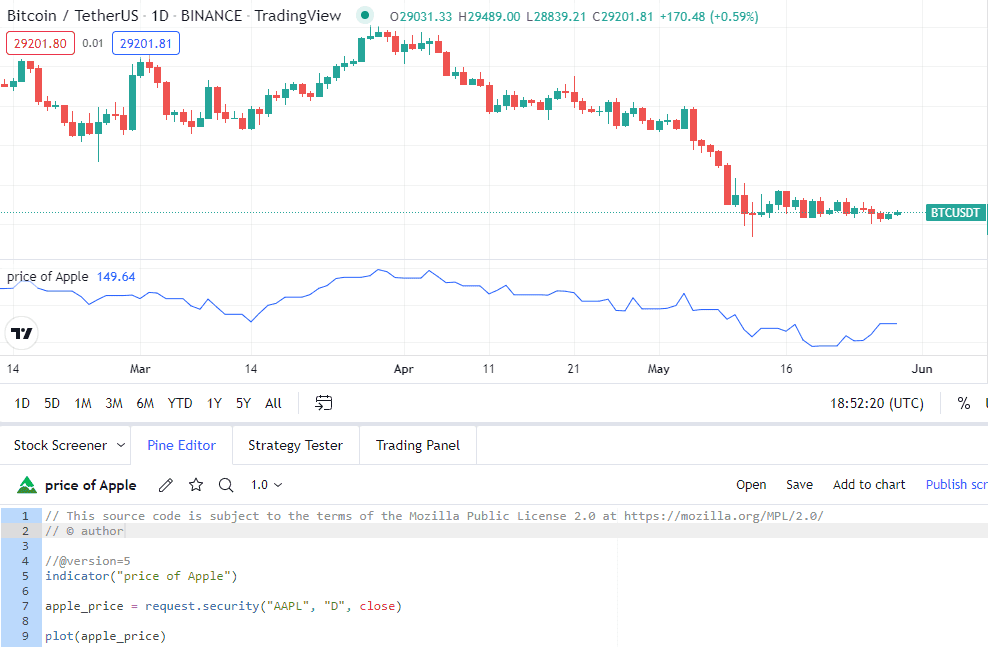
We now have Apple’s daily closing price plotted in the data window while the main window is showing a candlestick chart of Bitcoin.
Chúng tôi hiện có giá đóng cửa hàng ngày của Apple được vẽ trong cửa sổ dữ liệu trong khi cửa sổ chính đang hiển thị biểu đồ nến của Bitcoin.
Full Code: Mã đầy đủ:
//@version=5
indicator("price of Apple")

apple_price = request.security("AAPL", "D", close)

plot(apple_price)
How to retrieve the SMA(20) of Apple?
Làm thế nào để lấy SMA(20) của Apple?
Now that we can access Apple’s stock price, let’s go through an example of retrieving a simple moving average.
Bây giờ chúng ta có thể truy cập giá cổ phiếu của Apple, hãy cùng xem một ví dụ về việc lấy trung bình động đơn giản.
The same process can be used to apply any indicator.
Quá trình tương tự có thể được sử dụng để áp dụng bất kỳ chỉ báo nào.
We will start with our basic declarations and use the security function we created in our last example.
Chúng ta sẽ bắt đầu với các tuyên bố cơ bản của mình và sử dụng chức năng bảo mật mà chúng ta đã tạo ra trong ví dụ trước.
//@version=5
indicator("Get 20 SMA of Apple")

// Get price of Apple
apple_price = request.security("AAPL", "D", close) // 1 Day
If you’re not looking to get the 20 SMA specifically for AAPL, you can skip the security definition and just use the built-in close variable.
Nếu bạn không muốn lấy 20 SMA cụ thể cho AAPL, bạn có thể bỏ qua định nghĩa bảo mật và chỉ cần sử dụng biến tích hợp close .
This will grab the closing price for whichever security you have showing in your main chart window.
Điều này sẽ lấy giá đóng cửa cho bất kỳ chứng khoán nào bạn đang hiển thị trong cửa sổ biểu đồ chính của bạn.
There is a helper function for the SMA indicator built-in to Pine script. To access it, we simply use the ta.sma() function.
Có một hàm trợ giúp cho chỉ báo SMA được tích hợp sẵn trong Pine script. Để truy cập nó, chúng ta chỉ cần sử dụng hàm ta.sma().
ta.sma(apple_price, 20)The first parameter we need to pass in is the price value. In this case, we are using the closing price for Apple that we have stored in our apple_price variable.
Tham số đầu tiên mà chúng ta cần truyền vào là giá trị giá. Trong trường hợp này, chúng ta đang sử dụng giá đóng cửa của Apple mà chúng ta đã lưu trữ trong biến apple_price của mình.
The second parameter is the length of the SMA. We are looking for a 20-period SMA.
Tham số thứ hai là độ dài của SMA. Chúng tôi đang tìm một SMA 20 kỳ.
Lastly, we will assign the SMA data to a separate variable and then plot it.
Cuối cùng, chúng ta sẽ gán dữ liệu SMA cho một biến riêng và sau đó vẽ nó.
apple_sma = ta.sma(apple_price, 20)

plot(apple_sma)
The simple moving average for Apple is now plotted to our data window.
Đường trung bình động đơn giản cho Apple hiện đã được vẽ trên cửa sổ dữ liệu của chúng tôi.
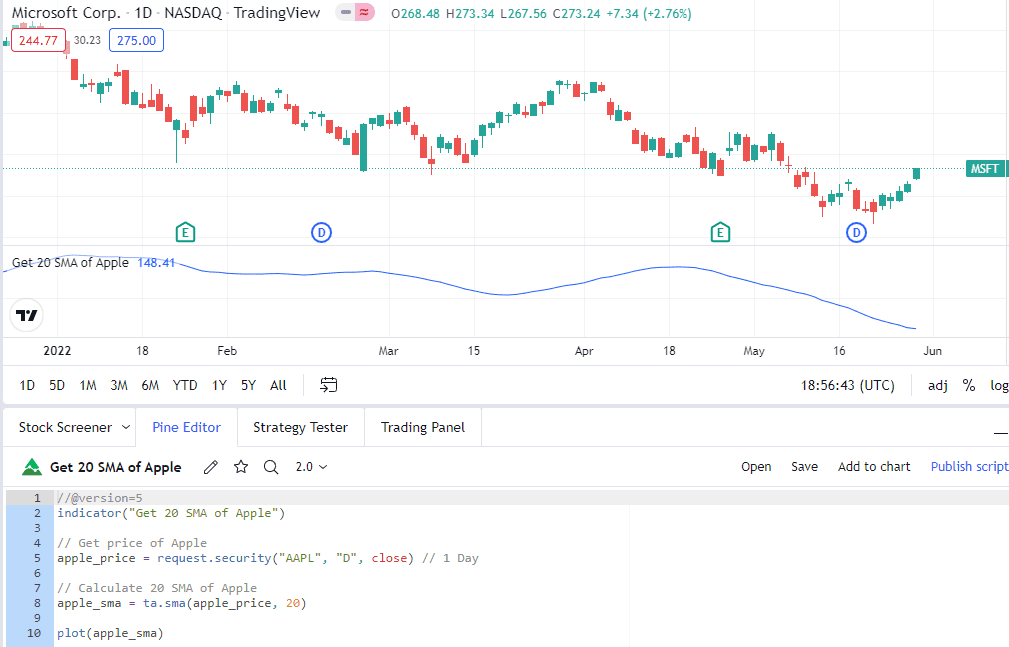
Moving averages are typically plotted on the main chart. We can achieve that with a slight modification in our code.
Các đường trung bình động thường được vẽ trên biểu đồ chính. Chúng ta có thể đạt được điều đó với một sự điều chỉnh nhỏ trong mã của mình.
indicator("Get 20 SMA of Apple", overlay=true)By adding in overlay=True into the indicator declaration, we can plot our data directly into the main charting window as opposed to the data window.
Bằng cách thêm overlay=True vào khai báo chỉ báo, chúng ta có thể vẽ dữ liệu của mình trực tiếp vào cửa sổ biểu đồ chính thay vì cửa sổ dữ liệu.
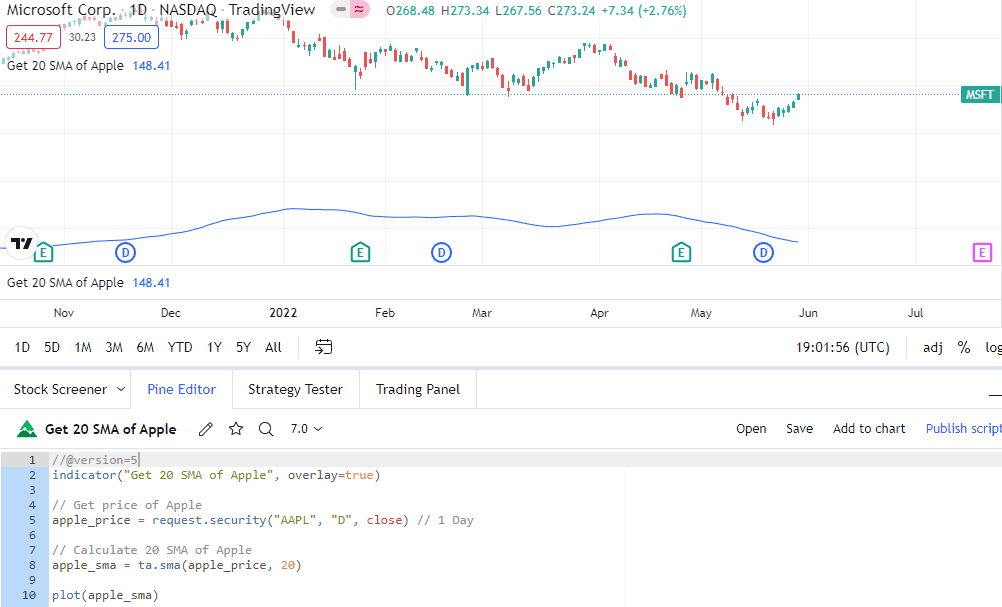
Full Code: Mã đầy đủ:
//@version=5
indicator("Get 20 SMA of Apple", overlay=true)

// Get price of Apple
apple_price = request.security("AAPL", "D", close) // 1 Day

// Calculate 20 SMA of Apple
apple_sma = ta.sma(apple_price, 20)

plot(apple_sma)
How to backtest a moving average cross strategy with Pine Script?
Làm thế nào để kiểm tra lại một chiến lược giao cắt trung bình động bằng Pine Script?
We’ve gone over indicators. Let’s take a look at strategies in Pine Script.
Chúng ta đã xem qua các chỉ báo. Hãy cùng xem xét các chiến lược trong Pine Script.
In the next example, we will create a moving average cross-over strategy with a few additional parameters. We will then backtest the strategy within TradingView.
Trong ví dụ tiếp theo, chúng ta sẽ tạo một chiến lược giao cắt trung bình động với một vài tham số bổ sung. Sau đó, chúng ta sẽ kiểm tra lại chiến lược trong TradingView.
//@version=5
strategy("My Strategy", overlay=true)
To create a strategy, we swap out the indicator declaration with a strategy declaration.
Để tạo ra một chiến lược, chúng ta thay thế khai báo chỉ báo bằng khai báo chiến lược.
// Create Indicator's
shortSMA = ta.sma(close, 10)
longSMA = ta.sma(close, 30)
The first thing we will want to do is create two moving averages and assign the data to variables.
Điều đầu tiên chúng ta muốn làm là tạo hai trung bình động và gán dữ liệu cho các biến.
rsi = ta.rsi(close, 14)We will also create an RSI indicator that will be used to confirm our entries and exits.
Chúng tôi cũng sẽ tạo ra một chỉ báo RSI sẽ được sử dụng để xác nhận các điểm vào và ra của chúng tôi.
This strategy will be run on the main chart so we don’t need to use the security() function here.
Chiến lược này sẽ được thực hiện trên biểu đồ chính nên chúng ta không cần sử dụng hàm security() ở đây.
Next, we want to specify our crossover conditions. Fortunately, TradingView has a built-in function for that already, so we don’t need to code it manually.
Tiếp theo, chúng ta muốn xác định các điều kiện giao nhau của mình. May mắn thay, TradingView đã có sẵn một chức năng cho điều đó, vì vậy chúng ta không cần phải lập trình thủ công.
// Specify crossover conditions
longCondition = ta.crossover(shortSMA, longSMA)
shortCondition = ta.crossunder(shortSMA, longSMA)
We have two conditions, the first one is when the short SMA, the 10-period, crosses above the longer 30-period SMA.
Chúng ta có hai điều kiện, điều kiện đầu tiên là khi SMA ngắn hạn, 10 kỳ, cắt lên trên SMA dài hạn 30 kỳ.
The second condition is the opposite as we’ve used the crossunder function as opposed to crossover.
Điều kiện thứ hai là ngược lại vì chúng ta đã sử dụng hàm crossunder thay vì crossover.
Both these conditions are saved to variables. So when the crossover or crossunder occurs, these variables will get updated to True which is a Boolean value.
Cả hai điều kiện này được lưu vào các biến. Vì vậy, khi xảy ra sự giao nhau hoặc cắt nhau, các biến này sẽ được cập nhật thành True, một giá trị Boolean.
We can use an if statement to check if the condition is changed to True, and then execute a trade based if that is the case.
Chúng ta có thể sử dụng câu lệnh if để kiểm tra xem điều kiện có thay đổi thành True hay không, và sau đó thực hiện một giao dịch dựa trên điều đó nếu đúng.
if (longCondition)
    strategy.entry("long", strategy.long, 100, when = rsi > 50)
The built-in strategy.entry function is used to enter trades. Here are the parameters that are passed into the function.
Hàm tích hợp sẵn strategy.entry được sử dụng để thực hiện giao dịch. Dưới đây là các tham số được truyền vào hàm.
- “long” – this is a trade ID. We won’t be using it in this example. But, if you plan to close or cancel a trade, it can be done with this ID.
“long” – đây là một ID giao dịch. Chúng tôi sẽ không sử dụng nó trong ví dụ này. Nhưng, nếu bạn dự định đóng hoặc hủy một giao dịch, điều đó có thể được thực hiện với ID này. - strategy.long – this is a built-in variable that tells Pine script that we want to get long.
strategy.long – đây là một biến tích hợp cho biết Pine script rằng chúng ta muốn vào lệnh mua. - 100 – the number of shares we want to trade
100 – số lượng cổ phiếu mà chúng tôi muốn giao dịch - when = rsi > 50 – this is an additional parameter that tells pine script to only execute the trade if the RSI is higher than 50.
khi = rsi > 50 – đây là một tham số bổ sung cho biết pine script chỉ thực hiện giao dịch nếu RSI cao hơn 50.
The syntax for our short entries will follow a very similar format.
Cú pháp cho các mục ngắn của chúng tôi sẽ theo một định dạng rất tương tự.
if (shortCondition)
    strategy.entry("short", strategy.short, 100, when = rsi < 50)
Since we are running a strategy, we don’t have to plot anything or specify an output.
Vì chúng tôi đang thực hiện một chiến lược, chúng tôi không cần phải vẽ bất cứ điều gì hoặc chỉ định một đầu ra.
But we will do so anyway. It would be nice to see the SMA’s on the chart so that we can confirm that trades took place when they should have.
Nhưng chúng tôi sẽ làm như vậy. Thật tuyệt nếu thấy các SMA trên biểu đồ để chúng tôi có thể xác nhận rằng các giao dịch đã diễn ra khi chúng nên có.
// Plot Moving Average's to chart
plot(shortSMA)
plot(longSMA, color=color.black)
If we save and add to chart, the strategy will run and automatically open the Strategy Tester window which will display some important stats.
Nếu chúng ta lưu và thêm vào biểu đồ, chiến lược sẽ chạy và tự động mở cửa sổ Kiểm tra Chiến lược, nơi sẽ hiển thị một số thống kê quan trọng.
This is what our screen looks like.
Đây là hình ảnh màn hình của chúng tôi.
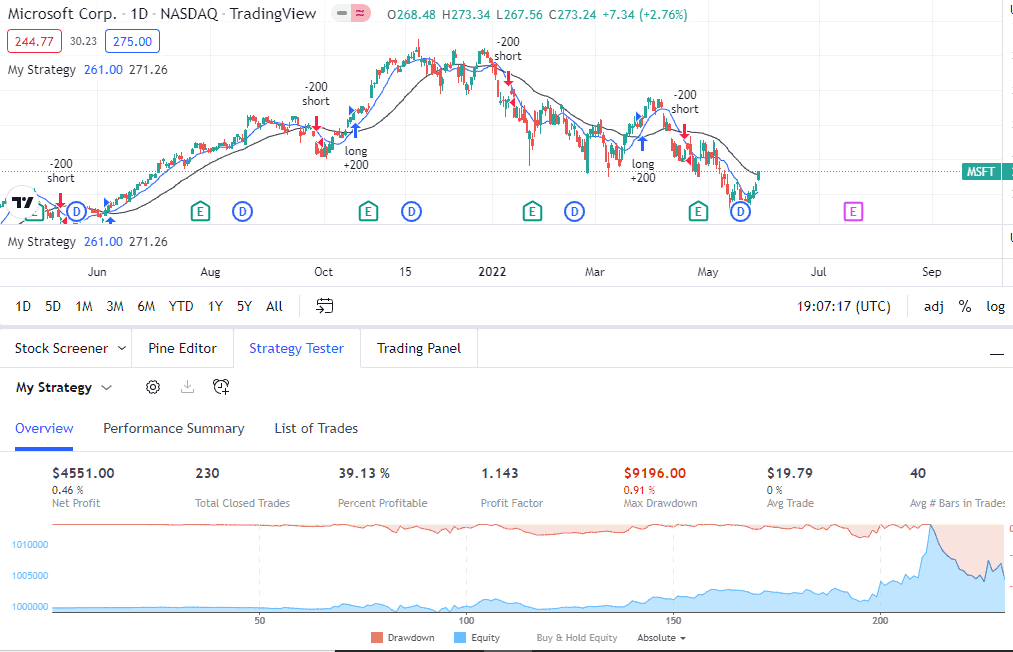
By default, a new tab opens showing the overview stats for the strategy. You can click through the Performance Summary or List of Trades to see other statistics.
Theo mặc định, một tab mới sẽ mở ra hiển thị thống kê tổng quan cho chiến lược. Bạn có thể nhấp vào Tóm tắt Hiệu suất hoặc Danh sách Giao dịch để xem các thống kê khác.
The strategy will run on the time frame that is displayed on your chart.
Chiến lược sẽ hoạt động trên khung thời gian được hiển thị trên biểu đồ của bạn.
You can easily cycle through different time frames using the time frame options in the menu at the top of the screen. The strategy will auto-update based on the new time frame chosen.
Bạn có thể dễ dàng chuyển đổi giữa các khung thời gian khác nhau bằng cách sử dụng các tùy chọn khung thời gian trong menu ở đầu màn hình. Chiến lược sẽ tự động cập nhật dựa trên khung thời gian mới được chọn.
Full Code: Mã đầy đủ:
//@version=5
strategy("My Strategy", overlay=true)

// Create Indicator's
shortSMA = ta.sma(close, 10)
longSMA = ta.sma(close, 30)
rsi = ta.rsi(close, 14)

// Specify crossover conditions
longCondition = ta.crossover(shortSMA, longSMA)
shortCondition = ta.crossunder(shortSMA, longSMA)

// Execute trade if condition is True
if (longCondition)
    strategy.entry("long", strategy.long, 100, when = rsi > 50)

if (shortCondition)
    strategy.entry("short", strategy.short, 100, when = rsi < 50)

// Plot Moving Average's to chart
plot(shortSMA)
plot(longSMA, color=color.black)
How to set take profits and stop losses?
Cách đặt chốt lời và cắt lỗ?
In our last example, the trade execution was determined by moving average crossovers and crossunders.
Trong ví dụ cuối cùng của chúng tôi, việc thực hiện giao dịch được xác định bởi các điểm giao cắt và cắt xuống của đường trung bình động.
We will build on this script and set specific stop losses and take profits. We can use the Average True Range (ATR) to calculate the levels for these.
Chúng tôi sẽ xây dựng trên kịch bản này và đặt các mức dừng lỗ và chốt lời cụ thể. Chúng tôi có thể sử dụng Phạm vi Thực tế Trung bình (ATR) để tính toán các mức cho những điều này.
The ATR indicator calculates the average movement over the last number of specified bars. This is a good way to account for changes in volatility.
Chỉ báo ATR tính toán sự di chuyển trung bình trong số thanh đã chỉ định gần đây. Đây là một cách tốt để tính đến sự thay đổi trong độ biến động.
We have already declared several indicators, we will add the ATR indicator to the list.
Chúng tôi đã công bố một số chỉ báo, chúng tôi sẽ thêm chỉ báo ATR vào danh sách.
// Create Indicator's
shortSMA = ta.sma(close, 10)
longSMA = ta.sma(close, 30)
rsi = ta.rsi(close, 14)
atr = ta.atr(14)
Under our trade conditions, we can make the necessary calculations for our stop loss and take profit.
Dưới các điều kiện giao dịch của chúng tôi, chúng tôi có thể thực hiện các tính toán cần thiết cho việc dừng lỗ và chốt lời.
if (longCondition)
    stopLoss = low - atr * 2
    takeProfit = high + atr * 2
    strategy.entry("long", strategy.long, 100, when = rsi > 50)
    strategy.exit("exit", "long", stop=stopLoss, limit=takeProfit)
In the code above, we calculated the stop loss by taking the low of the bar at the time of entry and subtracting the average true range multiplied by two.
Trong đoạn mã trên, chúng tôi đã tính toán mức dừng lỗ bằng cách lấy giá thấp của thanh tại thời điểm vào lệnh và trừ đi khoảng dao động thực trung bình nhân với hai.
So if the stock moves on average $5 per bar, we are setting our take profit $10 below the low.
Vì vậy, nếu cổ phiếu di chuyển trung bình 5 đô la mỗi thanh, chúng tôi đặt mức chốt lời của mình thấp hơn 10 đô la so với mức thấp.
A similar calculation is done for the take profit.
Một phép tính tương tự được thực hiện cho việc chốt lời.
Lastly, we specify the exit condition using the strategy.exit() function. Here are the parameters that were passed through.
Cuối cùng, chúng tôi xác định điều kiện thoát bằng cách sử dụng hàm strategy.exit(). Dưới đây là các tham số đã được truyền qua.
- “exit” – this is the trade ID for exiting out of the trade.
“exit” – đây là ID giao dịch để thoát khỏi giao dịch. - ‘long” – this is the ID that we previously set when we entered the trade. This will let Pine script know which position we are trying to exit.
‘long” – đây là ID mà chúng tôi đã thiết lập trước đó khi chúng tôi thực hiện giao dịch. Điều này sẽ cho phép Pine script biết chúng tôi đang cố gắng thoát khỏi vị trí nào. - stop=stopLoss – we are specifying that the level contained in the stopLoss variable should be used as a stop order to exit the trade.
stop=stopLoss – chúng ta đang chỉ định rằng mức độ chứa trong biến stopLoss nên được sử dụng như một lệnh dừng để thoát khỏi giao dịch. - limit=takeProfit = we are specifying that the level contained in the takeProfit variable should be used as a limit order to exit the trade.
limit=takeProfit = chúng tôi đang chỉ định rằng mức độ chứa trong biến takeProfit nên được sử dụng như một lệnh giới hạn để thoát khỏi giao dịch.
The syntax for our short condition is similar although some of the calculations are slightly different.
Cú pháp cho điều kiện ngắn của chúng tôi tương tự mặc dù một số phép tính có chút khác biệt.
if (shortCondition)
    stopLoss = high + atr * 2
    takeProfit = low - atr * 2
    strategy.entry("short", strategy.short, 100, when = rsi < 50)
    strategy.exit("exit", "short", stop=stopLoss, limit=takeProfit)
The rest of the script remains unchanged from the prior example. Let’s run it and see how our strategy did.
Phần còn lại của kịch bản không thay đổi so với ví dụ trước. Hãy chạy nó và xem chiến lược của chúng ta đã hoạt động như thế nào.
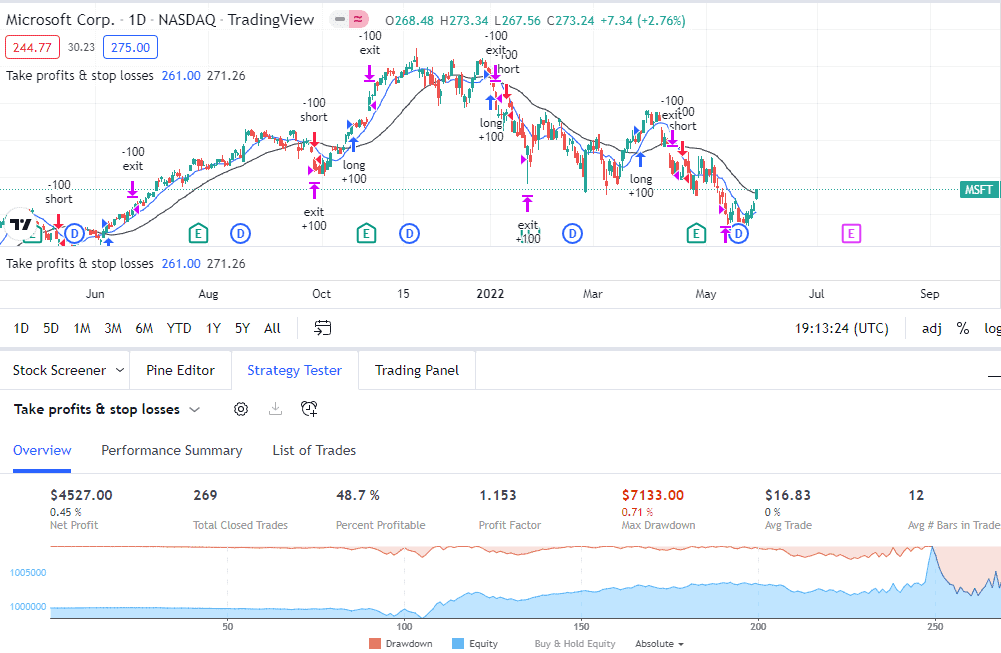
Our exits are working and being plotted on our main chart along with the long and short entries.
Các lối thoát của chúng tôi đang hoạt động và được vẽ trên biểu đồ chính của chúng tôi cùng với các điểm vào dài và ngắn.
Full Code: Mã đầy đủ:
//@version=5
strategy("Take profits & stop losses", overlay=true)

// Create Indicator's
shortSMA = ta.sma(close, 10)
longSMA = ta.sma(close, 30)
rsi = ta.rsi(close, 14)
atr = ta.atr(14)

// Specify crossover conditions
longCondition = ta.crossover(shortSMA, longSMA)
shortCondition = ta.crossunder(shortSMA, longSMA)

// Execute trade if condition is True
if (longCondition)
    stopLoss = low - atr * 2
    takeProfit = high + atr * 2
    strategy.entry("long", strategy.long, 100, when = rsi > 50)
    strategy.exit("exit", "long", stop=stopLoss, limit=takeProfit)

if (shortCondition)
    stopLoss = high + atr * 2
    takeProfit = low - atr * 2
    strategy.entry("short", strategy.short, 100, when = rsi < 50)
    strategy.exit("exit", "short", stop=stopLoss, limit=takeProfit)

// Plot Moving Average's to chart
plot(shortSMA)
plot(longSMA, color=color.black)
How to fire a trade on Apple when Google moves 5%?
Cách thực hiện giao dịch trên Apple khi Google di chuyển 5%?
We’ve seen that the security function can be used to display data for stocks not shown on the screen.
Chúng tôi đã thấy rằng chức năng bảo mật có thể được sử dụng để hiển thị dữ liệu cho các cổ phiếu không được hiển thị trên màn hình.
We will use it to create a strategy that will execute a trade in Apple if Google moves more than 5%.
Chúng tôi sẽ sử dụng nó để tạo ra một chiến lược sẽ thực hiện giao dịch trong Apple nếu Google di chuyển hơn 5%.
This is a mean reversion strategy, so if Google rallies by more than 5%, we will short Apple. If Google falls by more than 5% then we can buy Apple.
Đây là một chiến lược hồi quy trung bình, vì vậy nếu Google tăng hơn 5%, chúng tôi sẽ bán khống Apple. Nếu Google giảm hơn 5% thì chúng tôi có thể mua Apple.
The first thing we will do is store Google’s daily open and closing price into a variable.
Điều đầu tiên chúng ta sẽ làm là lưu trữ giá mở cửa và giá đóng cửa hàng ngày của Google vào một biến.
//@version=5
strategy("Pair Trade: Apple & Google")

google_close = request.security("GOOG", "D", close)
google_open = request.security("GOOG", "D", open)
We can then perform a calculation to determine the percentage price change.
Chúng ta có thể thực hiện một phép tính để xác định tỷ lệ thay đổi giá.
price_change = google_close / google_openThe price_change variable now holds the calculation. So for example, if Google opened at $100 and rallied 5% to close at $105, the price_change variable would be 105/100 which is 1.05.
Biến price_change hiện đang giữ giá trị tính toán. Vì vậy, ví dụ, nếu Google mở cửa ở mức 100 đô la và tăng 5% để đóng cửa ở mức 105 đô la, biến price_change sẽ là 105/100, tức là 1.05.
But if Google opened at $100, and declined 5% to close at $95, the variable would read 95/100 which is 0.95.
Nhưng nếu Google mở cửa ở mức 100 đô la, và giảm 5% để đóng cửa ở mức 95 đô la, biến số sẽ đọc 95/100 tức là 0.95.
So we know that if Google declined 5% or more, the price_change variable would be 0.95 or less, and we want to get long. Here is the syntax to do that.
Vì vậy, chúng ta biết rằng nếu Google giảm 5% hoặc hơn, biến price_change sẽ là 0.95 hoặc thấp hơn, và chúng ta muốn mua vào. Đây là cú pháp để làm điều đó.
if price_change < 0.95
    strategy.entry("long", strategy.long, 100)
And the syntax to get short if Google rallies more than 5%.
Và cú pháp để bán khống nếu Google tăng hơn 5%.
if price_change > 1.05
    strategy.entry("short", strategy.short, 100)
You might notice that we have not mentioned Apple’s stock price in the code. All we need to do is open an AAPL chart and it will automatically know to execute the trades in Apple.
Bạn có thể nhận thấy rằng chúng tôi không đề cập đến giá cổ phiếu của Apple trong mã. Tất cả những gì chúng tôi cần làm là mở biểu đồ AAPL và nó sẽ tự động biết để thực hiện các giao dịch trên Apple.
Lastly, we will plot the price_change variable in the data window. It’s not necessary, but nice to see and we can confirm that the trades are being executed as they should.
Cuối cùng, chúng ta sẽ vẽ biến price_change trong cửa sổ dữ liệu. Điều này không cần thiết, nhưng thật tốt khi thấy và chúng ta có thể xác nhận rằng các giao dịch đang được thực hiện như chúng nên có.
plot(price_change)And here are the results of our strategy.
Và đây là kết quả của chiến lược của chúng tôi.
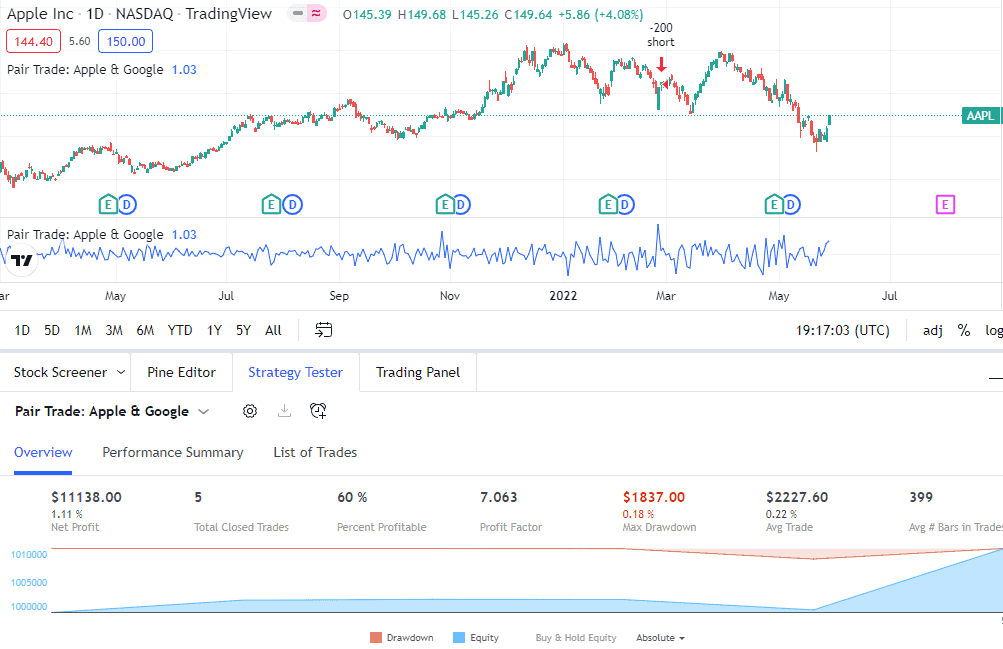
Only four trades as 5% movements are rare. We’d probably need to see a lot more trades than that to determine if it’s a good strategy.
Chỉ có bốn giao dịch vì các biến động 5% là hiếm. Chúng ta có lẽ cần thấy nhiều giao dịch hơn thế để xác định xem đó có phải là một chiến lược tốt hay không.
It did seem to have done a good job picking out that low in March!
Có vẻ như nó đã làm tốt việc chọn ra mức thấp đó vào tháng Ba!
Full Code: Mã đầy đủ:
//@version=5
strategy("Pair Trade: Apple & Google")

google_close = request.security("GOOG", "D", close)
google_open = request.security("GOOG", "D", open)

price_change = google_close / google_open

if price_change < 0.95
    strategy.entry("long", strategy.long, 100)

if price_change > 1.05
    strategy.entry("short", strategy.short, 100)

plot(price_change)
How to modify our scripts without coding?
Làm thế nào để chỉnh sửa các kịch bản của chúng tôi mà không cần lập trình?
A cool feature of Pine script is that we can create custom inputs to easily change the parameters of our strategies and indicators.
Một tính năng thú vị của Pine script là chúng ta có thể tạo ra các đầu vào tùy chỉnh để dễ dàng thay đổi các tham số của chiến lược và chỉ báo của mình.

Take a look at the standard ATR indicator offered in Tradingivew. Note how easy it is to modify the length and even the colors via the Style tab.
Hãy xem chỉ báo ATR tiêu chuẩn được cung cấp trong Tradingview. Lưu ý cách dễ dàng để thay đổi độ dài và thậm chí là màu sắc thông qua tab Kiểu.
We can achieve the same for the studies and strategies created in Pine script by using the input() function.
Chúng ta có thể đạt được điều tương tự cho các nghiên cứu và chiến lược được tạo ra trong Pine script bằng cách sử dụng hàm input().
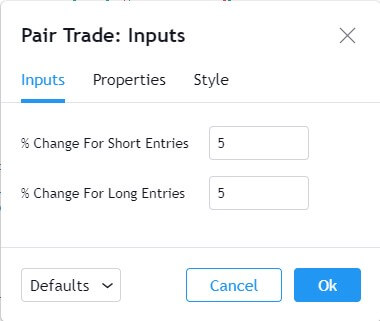
Here is an example of the input function that will allow the user to customize the percent change from the last strategy example.
Đây là một ví dụ về hàm đầu vào cho phép người dùng tùy chỉnh phần trăm thay đổi từ ví dụ chiến lược cuối cùng.
longTrigger = input(title="% Change for short entries", defval=5)

shortTrigger = input(title="% Change for long entries", defval=5)
Let’s go through the parameters that are passed through the input() function.
Hãy cùng xem qua các tham số được truyền qua hàm input().
- title – this is where we specify the text that the user sees when trying to change the value of that particular parameter.
tiêu đề – đây là nơi chúng tôi chỉ định văn bản mà người dùng thấy khi cố gắng thay đổi giá trị của tham số cụ thể đó. - defval – this is the default value.
defval – đây là giá trị mặc định.
We can now get values from the user. But they will be inputting a value such as 5(%). We need to convert this to 1.05 for our if statements.
Chúng ta bây giờ có thể lấy giá trị từ người dùng. Nhưng họ sẽ nhập một giá trị như 5(%). Chúng ta cần chuyển đổi điều này thành 1.05 cho các câu lệnh if của chúng ta.
longTrigger := 1 - longTrigger/100
shortTrigger := 1 + shortTrigger/100
And we need to change our if statements to look at our newly created variables based on user input rather than the previously hard-coded values.
Và chúng ta cần thay đổi các câu lệnh if của mình để xem xét các biến mới được tạo ra dựa trên đầu vào của người dùng thay vì các giá trị đã được mã hóa cứng trước đó.
if price_change < longTrigger
    strategy.entry("long", strategy.long, 100)

if price_change > shortTrigger
    strategy.entry("short", strategy.short, 100)
To access the input options, click on the gear icon next to the name of your strategy in the data window.
Để truy cập các tùy chọn đầu vào, hãy nhấp vào biểu tượng bánh răng bên cạnh tên chiến lược của bạn trong cửa sổ dữ liệu.
Custom values can now be set for the percentage change used in the strategy.
Giá trị tùy chỉnh hiện có thể được thiết lập cho tỷ lệ phần trăm thay đổi được sử dụng trong chiến lược.
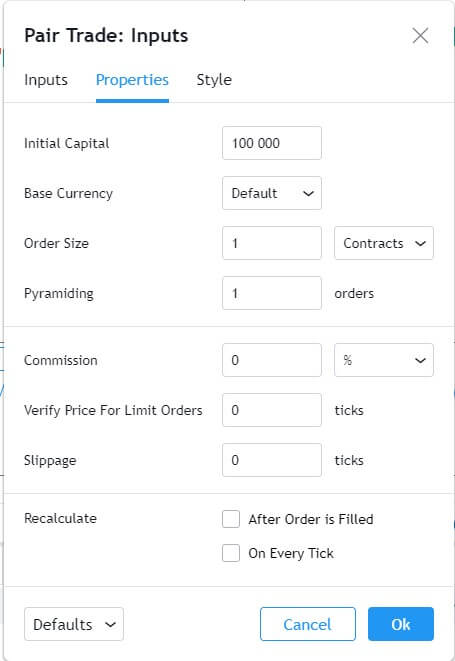
There is also a Properties window that will allow you to set custom options for other parts of the strategy.
Cũng có một cửa sổ Thuộc tính cho phép bạn thiết lập các tùy chọn tùy chỉnh cho các phần khác của chiến lược.
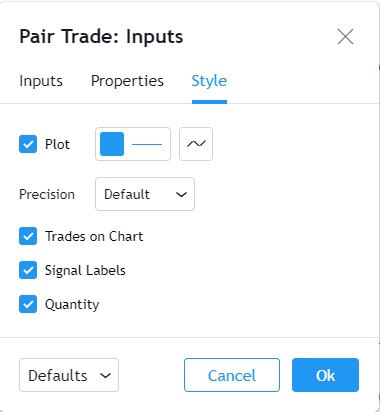
And a Style window to customize plotting options.
Và một cửa sổ Kiểu để tùy chỉnh các tùy chọn vẽ đồ thị.
Full Code: Mã đầy đủ:
//@version=5
strategy("Pair Trade: Inputs")

longTrigger = input(title="% Change for short entries", defval=5)
shortTrigger = input(title="% Change for long entries", defval=5)

longTrigger := 1 - longTrigger/100
shortTrigger := 1 + shortTrigger/100

google_close = request.security("GOOG", "D", close)
google_open = request.security("GOOG", "D", open)

price_change = google_close / google_open

if price_change < longTrigger
    strategy.entry("long", strategy.long, 100)

if price_change > shortTrigger
    strategy.entry("short", strategy.short, 100)

plot(price_change)
How to Plot with Pine script?
Cách vẽ với Pine script?
So far we’ve used the standard plot() function to plot certain things to the screen. Pine script has several other commands that we can use for our output and we will go through a few of them.
Cho đến nay, chúng ta đã sử dụng hàm plot() tiêu chuẩn để vẽ một số thứ lên màn hình. Pine script có một số lệnh khác mà chúng ta có thể sử dụng cho đầu ra của mình và chúng ta sẽ đi qua một vài lệnh trong số đó.
Plotting Forex market hours
Vẽ giờ giao dịch Forex
Knowing when the markets open and close is something to be mindful of. This can be quite tough to figure out for Forex traders.
Biết khi nào thị trường mở và đóng là điều cần lưu ý. Điều này có thể khá khó khăn để xác định đối với các nhà giao dịch Forex.
Forex trades 24 hours a day and 5 days a week. Different markets around the world open and close during the day which impacts currency volatility.
Giao dịch Forex 24 giờ một ngày và 5 ngày một tuần. Các thị trường khác nhau trên thế giới mở và đóng trong suốt cả ngày, điều này ảnh hưởng đến sự biến động của tiền tệ.
Let’s program an indicator that will tell us with a quick glance at the chart when the markets are expected to be the busiest.
Hãy lập trình một chỉ báo sẽ cho chúng ta biết chỉ với một cái nhìn nhanh vào biểu đồ khi nào thị trường dự kiến sẽ bận rộn nhất.
Most Forex traders are paying attention to the London and New York sessions. We will start by specifying the time for these sessions.
Hầu hết các nhà giao dịch Forex đang chú ý đến các phiên giao dịch London và New York. Chúng ta sẽ bắt đầu bằng cách xác định thời gian cho các phiên này.
//@version=5
indicator("Forex Sessions", overlay=true)

London = time(timeframe.period, "0700-1500")
NY = time(timeframe.period, "1200-2000")
We’ve used the time() function here to create a period. In the parameters, we are using 0700 UTC for the start time of the London session and 1500 UTC for the end time.
Chúng tôi đã sử dụng hàm time() ở đây để tạo ra một khoảng thời gian. Trong các tham số, chúng tôi đang sử dụng 0700 UTC cho thời gian bắt đầu của phiên London và 1500 UTC cho thời gian kết thúc.
The London variable will now contain the bar time if the bar falls in between that period. Otherwise, it will show a NaN (not a value).
Biến London bây giờ sẽ chứa thời gian thanh nếu thanh rơi vào khoảng thời gian đó. Nếu không, nó sẽ hiển thị NaN (không phải là giá trị).
We can use an if statement to see to check the output of the London variable.
Chúng ta có thể sử dụng một câu lệnh if để kiểm tra đầu ra của biến London .
val = if (na(London))
    1
else
    0
In the code above, we are using a built-in function called na(). What this does is check whether the variable has a NaN value or not.
Trong đoạn mã trên, chúng ta đang sử dụng một hàm tích hợp có tên là na(). Chức năng của nó là kiểm tra xem biến có giá trị NaN hay không.
if the Londonvariable returns Nan, it means the bar is outside of London trading hours.
nếu biến London trả về Nan, điều đó có nghĩa là thanh nằm ngoài giờ giao dịch của London.
In this event, a variable called val will be assigned the integer 1. Otherwise, the valvariable will be set at 0.
Trong sự kiện này, một biến gọi là val sẽ được gán giá trị nguyên 1. Nếu không, biến val sẽ được đặt ở 0.
Lastly, we plot the newly created valvariable.
Cuối cùng, chúng tôi vẽ biến val mới được tạo.
plot(val)Here is what our chart looks like after saving and adding this indicator to the chart.
Đây là hình ảnh biểu đồ của chúng tôi sau khi lưu và thêm chỉ báo này vào biểu đồ.
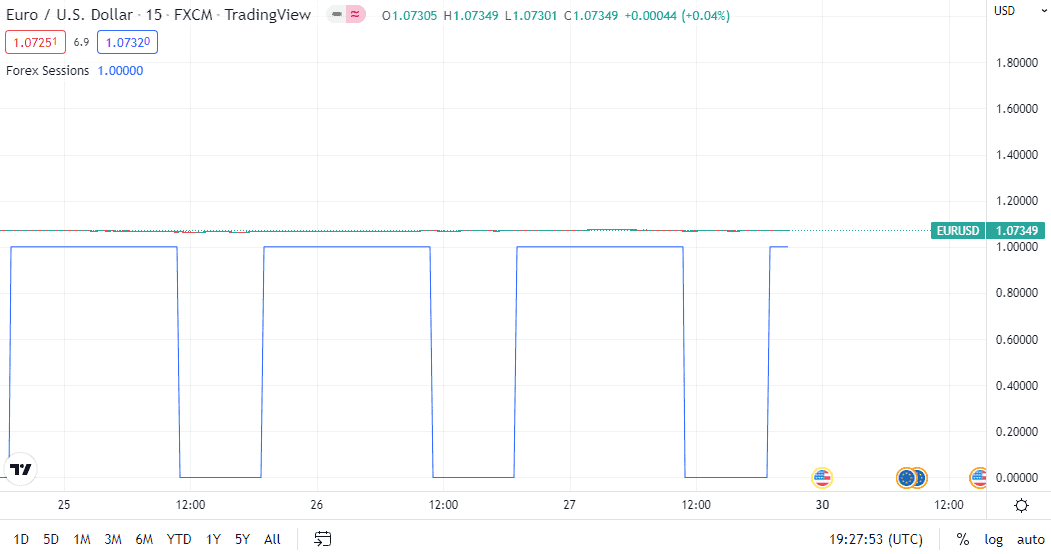
That doesn’t look too good. It is correctly showing when the London market is open, but plotting those values has made our candlesticks illegible.
Điều đó trông không tốt lắm. Nó hiển thị đúng khi nào thị trường London mở cửa, nhưng việc vẽ các giá trị đó đã làm cho các nến của chúng ta trở nên khó đọc.
We could plot it in the data window so that the candles are easier to see, but it still would not be easy to visualize the market open and close.
Chúng tôi có thể vẽ nó trong cửa sổ dữ liệu để các nến dễ nhìn hơn, nhưng vẫn sẽ không dễ để hình dung thị trường mở và đóng.
Also, the code doesn’t look too good.
Ngoài ra, mã cũng không trông đẹp lắm.
Let’s start by using a one-line if statement to clean up our code a bit.
Hãy bắt đầu bằng cách sử dụng câu lệnh if một dòng để làm sạch mã của chúng ta một chút.
na(London) ? 1 : 0This code performs the same function as the if statement before. We don’t need to use the valvariable in this case. Let’s break down the syntax.
Mã này thực hiện cùng một chức năng như câu lệnh if trước đó. Chúng ta không cần sử dụng biến val trong trường hợp này. Hãy phân tích cú pháp.
na(London)This part is checking to see if the Londonvariable contains a NaN value.
Phần này đang kiểm tra xem biến London có chứa giá trị NaN hay không.
? 1 : 0The question mark here is a short form for an if/else statement.
Dấu hỏi ở đây là một dạng ngắn gọn cho câu lệnh if/else.
What follows the question mark is the important part. There are two numbers here separated by a colon. The number before the colon, 1 in this case, is what should be returned in the event the if statement is true.
Phần quan trọng theo dấu hỏi là. Có hai số ở đây được phân tách bởi dấu hai chấm. Số trước dấu hai chấm, 1 trong trường hợp này, là số sẽ được trả về nếu câu lệnh if là đúng.
The number after the colon, 0 in this case, gets returned when the if statement returns false.
Số sau dấu hai chấm, 0 trong trường hợp này, được trả về khi câu lệnh if trả về false.
We can then take the entire syntax and wrap it in a plot function, saving the effort of storing it to a variable first.
Chúng ta có thể lấy toàn bộ cú pháp và bọc nó trong một hàm vẽ, tiết kiệm công sức lưu trữ nó vào một biến trước.
plot(na(London) ? 1 : 0)So now we’ve cleaned up the if statement into a one-line piece of code.
Vậy bây giờ chúng ta đã làm sạch câu lệnh if thành một đoạn mã một dòng.
To make the chart easier to read, we can plot a different background color if the London market is open.
Để làm cho biểu đồ dễ đọc hơn, chúng ta có thể vẽ một màu nền khác nếu thị trường London đang mở.
To do this, we swap the plot() function with the bgcolor() function. This allows us to change the background color.
Để làm điều này, chúng ta thay thế hàm plot() bằng hàm bgcolor(). Điều này cho phép chúng ta thay đổi màu nền.
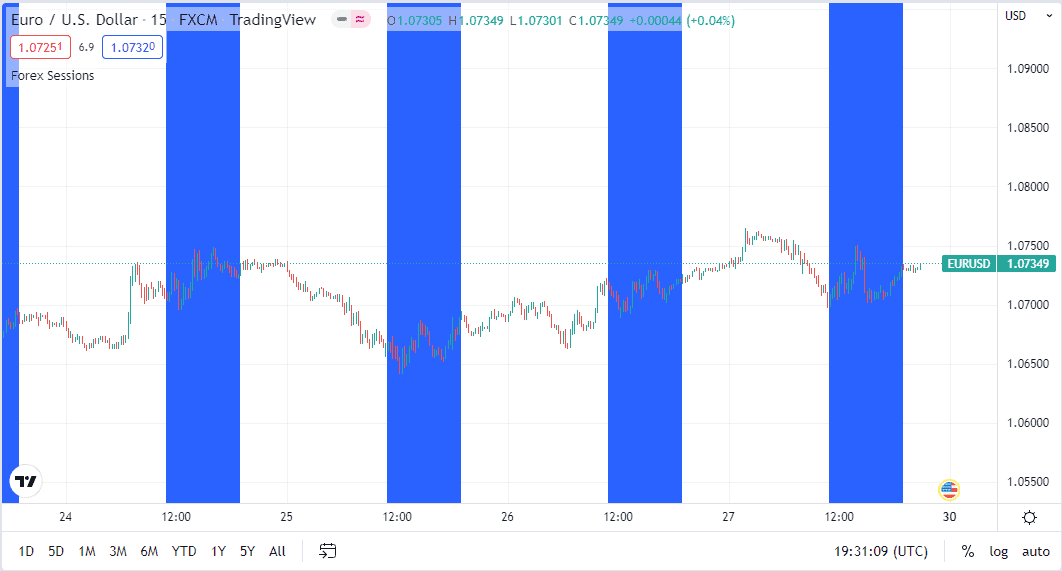
bgcolor(na(London) ? 1 : 0)Also, we will specify a color for when the market is open.
Ngoài ra, chúng tôi sẽ chỉ định một màu cho khi thị trường mở.
bgcolor(na(London) ? na : color.blue)Our chart is starting to look a lot better!
Biểu đồ của chúng ta bắt đầu trông tốt hơn nhiều!
The last thing we will do is add code to see if the New York market is open, and set the background to green if it is.
Điều cuối cùng chúng ta sẽ làm là thêm mã để xem liệu thị trường New York có mở không, và đặt nền tảng thành màu xanh nếu có.
bgcolor(na(NY) ? na : color.green)You’ll notice that there are three colors on the chart below.
Bạn sẽ nhận thấy rằng có ba màu trên biểu đồ bên dưới.
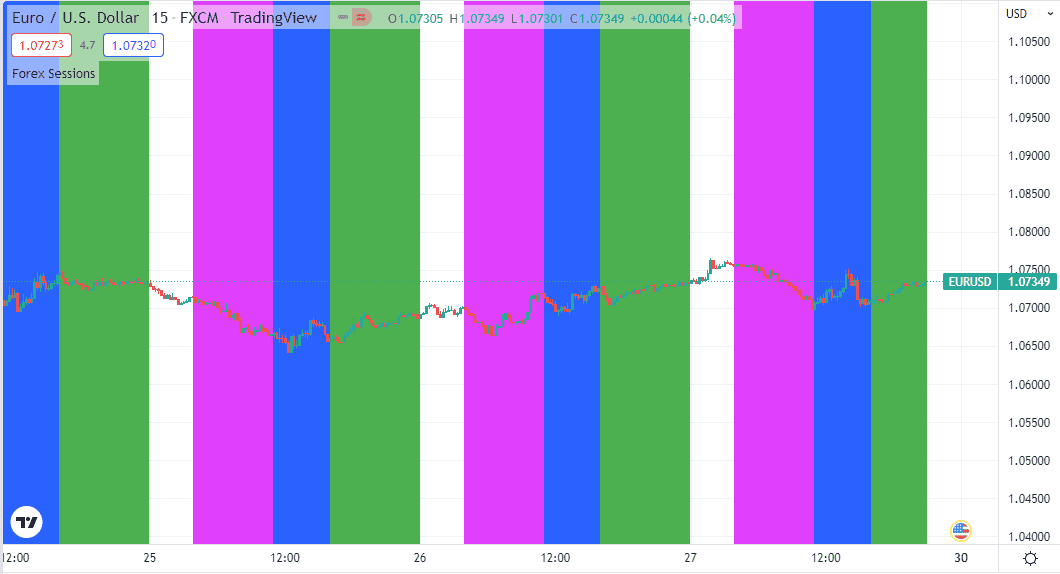
That’s because there is an overlap between the London and New York sessions, this is usually the most volatile time of the day.
Điều đó là vì có sự chồng chéo giữa các phiên giao dịch ở London và New York, đây thường là thời điểm biến động nhất trong ngày.
Now we can easily see the sessions and quickly pick out things like the high set in European trading or the low that was printed during the overlap.
Bây giờ chúng ta có thể dễ dàng thấy các phiên giao dịch và nhanh chóng chọn ra những điều như mức cao trong giao dịch châu Âu hoặc mức thấp đã được ghi nhận trong thời gian chồng chéo.
Full Code: Mã đầy đủ:
//@version=5
indicator("Forex Sessions", overlay=true)

Tokyo = time(timeframe.period, "0000-0800")
London = time(timeframe.period, "0700-1500")
NY = time(timeframe.period, "1200-2000")

bgcolor(na(Tokyo) ? na : color.fuchsia)
bgcolor(na(London) ? na : color.blue)
bgcolor(na(NY) ? na : color.green)
Plotting Annotations Chú thích đồ thị
There are several options to print annotations. As an example, you can use the hline() function to draw a horizontal level across the chart.
Có vài tùy chọn để in chú thích. Ví dụ, bạn có thể sử dụng hàm hline() để vẽ một mức ngang qua biểu đồ.
There is a plotchar() function that allows you to plot ASCII characters on your chart. This is often used to plot a note either on top or on the bottom of the price bar.
Có một hàm plotchar() cho phép bạn vẽ các ký tự ASCII trên biểu đồ của bạn. Điều này thường được sử dụng để vẽ một ghi chú ở trên hoặc dưới thanh giá.
Another common plotting function is plotshape() which allows you to plot various shapes. This one is quite popular as a lot of people use it to plot arrows on the top or bottom of bars to show buy or sell signals.
Một hàm vẽ đồ thị phổ biến khác là plotshape() cho phép bạn vẽ các hình dạng khác nhau. Hàm này khá phổ biến vì nhiều người sử dụng nó để vẽ mũi tên ở trên hoặc dưới các thanh để hiển thị tín hiệu mua hoặc bán.
For a complete list of the various annotations available, check out the Annotations overview in the Pine script user manual.
Để có danh sách đầy đủ các chú thích khác nhau có sẵn, hãy xem phần Tổng quan về Chú thích trong hướng dẫn người dùng Pine script.
How can I create a custom indicator in Pine script?
Làm thế nào tôi có thể tạo một chỉ báo tùy chỉnh trong Pine script?
We are going to create a multi-timeframe indicator.
Chúng tôi sẽ tạo ra một chỉ báo đa khung thời gian.
This is based on a scalping strategy that I used when I first started trading. It is a mean reversion strategy that works well during the early Asian session in the Forex markets when things are generally quiet.
Đây là dựa trên một chiến lược scalping mà tôi đã sử dụng khi tôi mới bắt đầu giao dịch. Đây là một chiến lược hồi quy trung bình hoạt động tốt trong phiên giao dịch châu Á sớm trên thị trường Forex khi mọi thứ thường yên tĩnh.
The strategy uses Bollinger Bands on a 5-minute chart and RSI on a 1-minute chart.
Chiến lược sử dụng dải Bollinger trên biểu đồ 5 phút và RSI trên biểu đồ 1 phút.
The idea is to look for rsi divergence on a 1-minute chart when the price reaches the upper or lower Bollinger band on a 5-minute chart.
Ý tưởng là tìm kiếm sự phân kỳ rsi trên biểu đồ 1 phút khi giá chạm vào dải Bollinger trên hoặc dưới trên biểu đồ 5 phút.
A potential target is the midline of the 5-minute Bollinger band or the lower line of a 1-minute Bollinger band.
Một mục tiêu tiềm năng là đường giữa của dải Bollinger 5 phút hoặc đường dưới của dải Bollinger 1 phút.
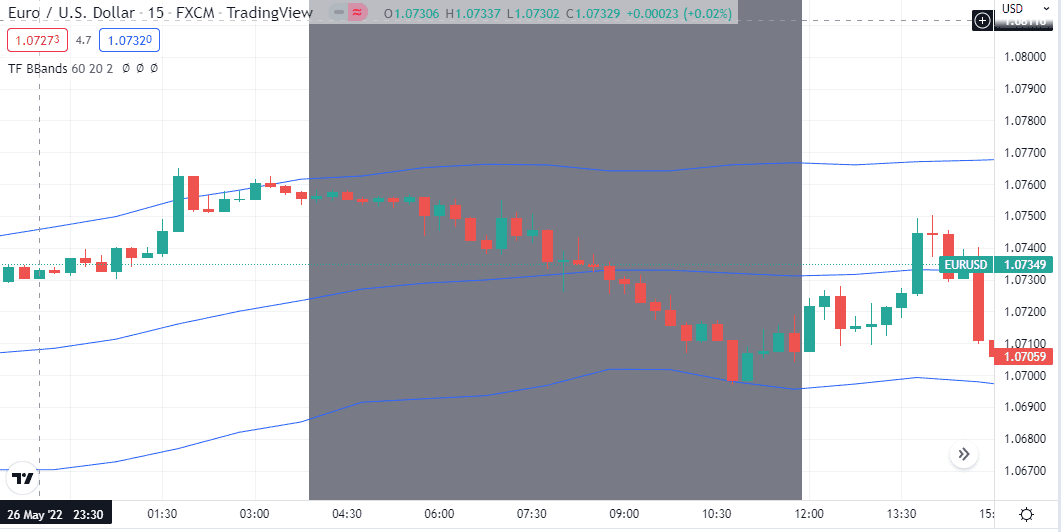
The above image is an example of the strategy. The Forex sessions indicator that we used in a previous example was used here to show when the Asian session is open.
Hình ảnh trên là một ví dụ về chiến lược. Chỉ báo phiên Forex mà chúng tôi đã sử dụng trong một ví dụ trước đó được sử dụng ở đây để cho thấy khi nào phiên châu Á mở cửa.
This strategy works best in the first half of the session, after that the risk of a breakout or directional move tends to increase.
Chiến lược này hoạt động tốt nhất trong nửa đầu của phiên, sau đó rủi ro về một sự bứt phá hoặc chuyển động theo hướng có xu hướng tăng lên.
When I traded this strategy, I had to keep two charts open, a 1-minute and a 5-minute chart.
Khi tôi giao dịch chiến lược này, tôi phải giữ hai biểu đồ mở, một biểu đồ 1 phút và một biểu đồ 5 phút.
But the example above shows the 5-minute Bollinger bands drawn directly on a 1-minute chart. We will create this indicator in Pine script.
Nhưng ví dụ trên cho thấy các dải Bollinger 5 phút được vẽ trực tiếp trên biểu đồ 1 phút. Chúng tôi sẽ tạo chỉ báo này trong Pine script.
//@version=5
indicator(title="Higher TF BBands", shorttitle="TF BBands", overlay=true)
We start by declaring a name for the script and indicating it is an indicator. A shorter title can be added as well, this is the name that will be shown on the charts.
Chúng tôi bắt đầu bằng cách khai báo một tên cho kịch bản và chỉ ra rằng nó là một chỉ báo. Một tiêu đề ngắn hơn cũng có thể được thêm vào, đây là tên sẽ được hiển thị trên các biểu đồ.
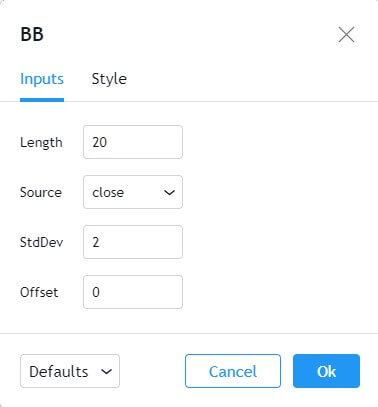
Next, we set some user inputs. We can duplicate most of the inputs from the regular Bollinger band indicator (as shown in the image above) for our custom indicator.
Tiếp theo, chúng ta thiết lập một số đầu vào của người dùng. Chúng ta có thể sao chép hầu hết các đầu vào từ chỉ báo Bollinger band thông thường (như được hiển thị trong hình ảnh trên) cho chỉ báo tùy chỉnh của chúng ta.
// Get user input
tf = input(title="BBands Timeframe", defval="5")
len = input(title="Length", defval=20)
stddev = input(title='StdDev', defval=2)
We can create the Bollinger band indicator from a built-in helper function.
Chúng ta có thể tạo chỉ báo dải Bollinger từ một hàm trợ giúp tích hợp sẵn.
[middle, upper, lower] = ta.bb(close, len, stddev)There are three values returned from this function. The lower, mid, and upper band. These are saved individually to variables.
Có ba giá trị được trả về từ hàm này. Dải thấp, dải giữa và dải cao. Những giá trị này được lưu riêng vào các biến.
The values should be calculated on a different time frame. We can use the security() function to point to the time frame chosen by the user.
Các giá trị nên được tính toán trên một khung thời gian khác. Chúng ta có thể sử dụng hàm security() để chỉ đến khung thời gian được người dùng chọn.
This is stored in the tf variable created by the earlier user input.
Điều này được lưu trữ trong biến tf được tạo ra bởi đầu vào của người dùng trước đó.
hbbandsMid = request.security(syminfo.tickerid, tf, middle, barmerge.gaps_on, barmerge.lookahead_off)
hbbandsUpper = request.security(syminfo.tickerid, tf, upper, barmerge.gaps_on, barmerge.lookahead_off)
hbbandsLower = request.security(syminfo.tickerid, tf, lower, barmerge.gaps_on, barmerge.lookahead_off)
The ticker symbol remains the same, so we’ve used syminfo.tickerid which will return whichever ticker is being displayed on the main chart.
Biểu tượng mã chứng khoán vẫn giữ nguyên, vì vậy chúng tôi đã sử dụng syminfo.tickerid sẽ trả về bất kỳ mã chứng khoán nào đang được hiển thị trên biểu đồ chính.
And that does it, all that’s left is to plot the new indicator.
Và vậy là xong, tất cả những gì còn lại là vẽ chỉ báo mới.
plot(hbbandsMid)
plot(hbbandsUpper)
plot(hbbandsLower)
We can now see Bollinger bands from a 5-minute chart displayed on a 1-minute chart.
Chúng ta bây giờ có thể thấy các dải Bollinger từ biểu đồ 5 phút hiển thị trên biểu đồ 1 phút.
The inputs allow for easy customization of Bollinger band parameters and allow this indicator to work with any time frame combination.
Các đầu vào cho phép tùy chỉnh dễ dàng các tham số của dải Bollinger và cho phép chỉ báo này hoạt động với bất kỳ sự kết hợp khung thời gian nào.
Full Code: Mã đầy đủ:
//@version=5
indicator(title="Higher TF BBands", shorttitle="TF BBands", overlay=true)

// Get user input
tf = input(title="BBands Timeframe", defval="60")
len = input(title="Length", defval=20)
stddev = input(title='StdDev', defval=2)

[middle, upper, lower] = ta.bb(close, len, stddev)

hbbandsMid = request.security(syminfo.tickerid, tf, middle, barmerge.gaps_on, barmerge.lookahead_off)
hbbandsUpper = request.security(syminfo.tickerid, tf, upper, barmerge.gaps_on, barmerge.lookahead_off)
hbbandsLower = request.security(syminfo.tickerid, tf, lower, barmerge.gaps_on, barmerge.lookahead_off)

plot(hbbandsMid)
plot(hbbandsUpper)
plot(hbbandsLower)
Final Thoughts Suy nghĩ cuối cùng
If you’ve been following along with the examples, you will have a good idea of what Pine script is capable of doing.
Nếu bạn đã theo dõi các ví dụ, bạn sẽ có một ý tưởng tốt về những gì Pine script có thể làm.
Overall, there is a lot you can do with Pine script, even though it has certain limitations. It’s possible to code up a strategy really quickly once you get the hang of things.
Tổng thể, có rất nhiều điều bạn có thể làm với Pine script, mặc dù nó có một số hạn chế nhất định. Bạn có thể lập trình một chiến lược rất nhanh chóng khi bạn đã quen với mọi thứ.
From there, it’s always an option to take that logic and program it into another language if you want to build on it and leverage third-party libraries.
Từ đó, luôn có tùy chọn để lấy logic đó và lập trình nó vào một ngôn ngữ khác nếu bạn muốn xây dựng trên đó và tận dụng các thư viện bên thứ ba.
The plotting functions are great, and the ability to make custom indicators is really useful for both manual traders and automated systems.
Các hàm vẽ đồ thị rất tuyệt, và khả năng tạo các chỉ báo tùy chỉnh thực sự hữu ích cho cả các nhà giao dịch thủ công và hệ thống tự động.
The comprehensive statistics offered for strategies is also a big plus point for Pine script.
Các thống kê toàn diện được cung cấp cho các chiến lược cũng là một điểm cộng lớn cho Pine script.
TradingView has several resources if you want to take your Pine script coding skills a step further.
TradingView có nhiều tài nguyên nếu bạn muốn nâng cao kỹ năng lập trình Pine script của mình.

Some help functions have already been discussed in this article. In addition to that, there is also a help option from within Pine editor.
Một số chức năng trợ giúp đã được thảo luận trong bài viết này. Ngoài ra, còn có một tùy chọn trợ giúp từ bên trong trình chỉnh sửa Pine.
Here are a few other resources –
Dưới đây là một vài tài nguyên khác –
- Quickstart Guide – This gives an example of an indicator and breaks the script down line by line.
Hướng dẫn bắt đầu nhanh – Điều này cung cấp một ví dụ về chỉ báo và phân tích kịch bản từng dòng một. - Pine Script v5 User Manual – A detailed manual for Pine script.
Hướng dẫn người dùng Pine Script v5 – Một hướng dẫn chi tiết cho Pine script. - TradingView Blog – Announcements of new features which often contain sample code
Blog TradingView – Thông báo về các tính năng mới thường chứa mã mẫu - TradingView Scripts Library – A library of open source Pine script studies and strategies.
Thư viện kịch bản TradingView – Một thư viện các nghiên cứu và chiến lược kịch bản Pine mã nguồn mở.
The last option on the list is a great resource as often another trader might have already coded the indicator or strategy you are after.
Lựa chọn cuối cùng trong danh sách là một nguồn tài nguyên tuyệt vời vì thường thì một nhà giao dịch khác có thể đã lập trình chỉ báo hoặc chiến lược mà bạn đang tìm kiếm.
It is also a good resource to draw ideas from to build your own indicators or strategies.
Nó cũng là một nguồn tài nguyên tốt để lấy ý tưởng xây dựng các chỉ báo hoặc chiến lược của riêng bạn.
If you’d like to try out some of the examples, a one-click download of all the code is available on GitHub. Simply click the green button and choose download zip. The code will be in text files which can be copied over to Tradingview’s Pine editor.
Nếu bạn muốn thử một số ví dụ, bạn có thể tải xuống tất cả mã bằng một cú nhấp chuột trên GitHub. Chỉ cần nhấp vào nút màu xanh và chọn tải xuống zip. Mã sẽ ở trong các tệp văn bản có thể được sao chép vào trình chỉnh sửa Pine của Tradingview.