正面。能源研究,2022 年 7 月 7 日
Sec. Sustainable Energy Systems
秒。可持续能源系统
Volume 10 - 2022 | https://doi.org/10.3389/fenrg.2022.741018
第 10 卷 - 2022 年 | https://doi.org/10.3389/fenrg.2022.741018

Research on Risk Features and Prediction of China’s Crude Oil Futures Market Based on Machine Learning
基于机器学习的中国原油期货市场风险特征及预测研究IF 3.4SCIEJCI 0.37Q3工程技术4区
- 1School of Mathematics and Statistics, Central South University, Changsha, China
1 中南大学数学与统计学院,长沙,中国 - 2School of Mathematics and Statistics, Hunan First Normal University, Changsha, china
2 湖南第一师范大学数学与统计学院,长沙,中国
Facing the rapidly changing domestic and foreign futures markets, how to accurately and immediately predict the price trend of crude oil futures in order to avoid the risks caused by price fluctuations is very important for all participants in the crude oil futures market. Based on the 5-min high-frequency trading data of China’s crude oil futures market in recent 3 years, this paper uses the EMD-MFDFA model combined with multifractal detrended fluctuation analysis (MF-DFA) and empirical mode decomposition unsupervised K-means clustering and Gaussian mixture model (GMM) to identify the risk status of each trading day. Further, Support vector machine (SVM), extreme gradient lifting (XGBoost) and their improved algorithms are used to predict the risk state of China’s crude oil futures market. The empirical results are as follows: first, There are obvious multifractal features in the return rate series of China’s crude oil futures market and its single trading day; Second, compared with the traditional SVM model, the improved Twin Support Vector Machine (TWSVM) based on solving the sample imbalance issue has better prediction ability for China’s crude oil futures risk.; Third, The XGBoost has a great impact on the prediction of China’s crude oil risk, and the Focal-XGBoost with focal loss function performs the best in predicting the risk of China’s crude oil futures market.
面对瞬息万变的国内外期货市场,如何准确、即时地预测原油期货的价格走势,以避免价格波动带来的风险,对于原油期货市场的所有参与者来说非常重要。本文基于近3年中国原油期货市场5 min高频交易数据,采用EMD-MFDFA模型结合多重分形去趋势波动分析(MF-DFA)和经验模态分解无监督K均值聚类高斯混合模型(GMM)来识别每个交易日的风险状态。进一步采用支持向量机(SVM)、极限梯度提升(XGBoost)及其改进算法来预测中国原油期货市场的风险状态。实证结果如下:第一,我国原油期货市场及其单个交易日收益率序列存在明显的多重分形特征;其次,与传统SVM模型相比,基于解决样本不平衡问题的改进双支持向量机(TWSVM)对我国原油期货风险具有更好的预测能力。第三,XGBoost对中国原油期货市场风险的预测影响较大,其中具有焦点损失函数的Focal-XGBoost对中国原油期货市场风险的预测效果最好。
Introduction 介绍
With the rapid development of economy, energy issues have become the focus of the world. Energy is indispensable to the world economic development, and crude oil plays an important role in the energy market. According to the 2019–2020 Blue Book of China’s Oil and Gas Industry Development Analysis and Prospect Report, China ranks among the top in both crude oil imports and consumption. Specifically, China’s crude oil imports reached 506 million tons in 2019, with a year-on-year growth of 9.5%, and its external dependence reached 70.8%. In terms of crude oil consumption, China consumed 696 million tons in 2019, with a year-on-year growth of 6.8%. The data indicate that the crude oil market has a huge impact on China’s energy economic market, and its price fluctuation often brings huge consequences.
随着经济的快速发展,能源问题已成为世界关注的焦点。世界经济发展离不开能源,原油在能源市场中占有重要地位。根据《2019-2020年中国石油天然气行业发展分析与前景报告蓝皮书》,中国原油进口量和消费量均位居前列。具体来看,2019年我国原油进口量达到5.06亿吨,同比增长9.5%,对外依存度达到70.8%。原油消费方面,2019年我国消费6.96亿吨,同比增长6.8%。数据表明,原油市场对我国能源经济市场影响巨大,其价格波动往往带来巨大后果。
With the rapid development of economy, energy issues have become the focus of the world. Energy is indispensable to the world economic development, and crude oil plays an important role in the energy market. According to the 2019–2020 Blue Book of China’s Oil and Gas Industry Development Analysis and Prospect Report, China ranks among the top in both crude oil imports and consumption. Specifically, China’s crude oil imports reached 506 million tons in 2019, with a year-on-year growth of 9.5%, and its external dependence reached 70.8%. In terms of crude oil consumption, China consumed 696 million tons in 2019, with a year-on-year growth of 6.8%. With the sustained and rapid growth of China’s economy, the demand for crude oil import and consumption is increasing, the fluctuation of crude oil price has an increasing impact on China.
随着经济的快速发展,能源问题已成为世界关注的焦点。世界经济发展离不开能源,原油在能源市场中占有重要地位。根据《2019-2020年中国石油天然气行业发展分析与前景报告蓝皮书》,中国原油进口量和消费量均位居前列。具体来看,2019年我国原油进口量达到5.06亿吨,同比增长9.5%,对外依存度达到70.8%。原油消费方面,2019年我国消费6.96亿吨,同比增长6.8%。随着我国经济持续快速增长,原油进口和消费需求不断增加,原油价格波动对我国的影响越来越大。
After years of development, the crude oil market, which is closely related to the economic development of each country, has formed a relatively authoritative price system, and its supply and demand as well as trade are carried out in the global scope. Before the official launch of Chinese crude futures, West Texas Intermediate (WTI) of the United States and Brent of the United Kingdom dominated the pricing system for global oil prices. After 17 years of careful planning, China’s crude oil futures market was officially listed on the Shanghai International Energy Exchange on 26 March 2018, denominated in RMB, and filled the gap of domestic crude oil futures market. Less than half a year after listing, China’s crude oil futures trading volume has reached 17 million contracts, accounting for 12% of the global crude oil futures market volume, and its accumulated trading volume reached 8.57 trillion yuan, ranking among the top three in the world. As can be seen from the data, China’s crude oil futures market is developing rapidly. Up to now, China’s crude oil futures market has exceeded 6% of the international market share, and the market activity has been continuously improved, becoming the third largest crude oil futures variety in the world after WTI and Brent.
经过多年的发展,与各国经济发展密切相关的原油市场已经形成了相对权威的价格体系,其供需和贸易在全球范围内进行。在中国原油期货正式推出之前,美国西德克萨斯中质原油(WTI)和英国布伦特原油主导了全球油价的定价体系。经过17年的精心筹划,中国原油期货市场于2018年3月26日在上海国际能源交易中心正式挂牌,以人民币计价,填补了国内原油期货市场的空白。上市不到半年,我国原油期货交易量已达1700万张合约,占全球原油期货市场交易量的12%,累计交易额达8.57万亿元,位居全球前三。世界。从数据可以看出,我国原油期货市场发展迅速。截至目前,我国原油期货市场占国际市场份额已超过6%,市场活跃度不断提升,成为继WTI、布伦特之后的全球第三大原油期货品种。
China’s oil futures is of great significance to the global oil futures market. It sets a benchmark for Asian oil futures markets and provides a channel for Chinese companies to hedge their oil consumption and avoid risks. At the same time, the establishment of a crude oil price benchmark level that reflects the relationship between demand and supply in China and the Asia-Pacific market has filled the gap in the existing international crude oil pricing system and increased China’s participation in the international market. However, compared with the mature crude oil futures market, China’s crude oil futures market, which has been established for a short time, has many aspects to be improved and the demand for risk aversion has become increasingly urgent. Therefore, it is necessary to study the risk status of China’s crude oil futures market from the perspective of market price fluctuation.
中国石油期货对全球石油期货市场具有重要意义。它为亚洲石油期货市场树立了基准,为中国企业对冲石油消费、规避风险提供了渠道。同时,反映中国及亚太市场供需关系的原油价格基准水平的建立,填补了现有国际原油定价体系的空白,提高了中国对国际市场的参与度。 。但与成熟的原油期货市场相比,成立时间较短的我国原油期货市场还有很多方面有待完善,避险需求日益迫切。因此,有必要从市场价格波动的角度研究我国原油期货市场的风险状况。
However, traditional risk research models, such as VaR (Value at Risk), are mainly based on the efficient market hypothesis (EMH) proposed by Fama. EMH believes that investors can respond to information rationally and linearly, so market prices can timely and fully reflect information changes in the system, that is, prices in the financial market have no long-term memory, and price fluctuations are unpredictable. However, a lot of research found that financial market usually shows nonlinear structural characteristics, and its complex operation mechanism, which cannot reflect the actual situation of the market, is contrary to the efficient market hypothesis. Therefore (Altman, 1967), proposed the nonlinear fractal theory for measuring financial investment risk. Further (Peters, 1994a), proposed the Fractal Market Hypothesis (FMH) on the basis of Mandelbrot’s theory. From the practical point of view, he regarded the capital market as a complex nonlinear dynamic system with the characteristics of interaction and self-adaptability. Therefore, FMH, with the characteristics of interaction and self-adaptability, can better describe the complexity of the market, analyze the nonlinear dynamic characteristics of market price fluctuations, measure the impact of information on prices, and explore the predictability of the market. A large number of studies also show that fractal features are indeed universal in financial markets.
然而,传统的风险研究模型,如VaR(Value at Risk),主要基于Fama提出的有效市场假说(EMH)。 EMH认为,投资者能够对信息进行理性、线性的反应,因此市场价格能够及时、充分地反映系统中的信息变化,即金融市场的价格没有长期记忆,价格波动是不可预测的。然而大量研究发现,金融市场通常表现出非线性的结构特征,其复杂的运行机制不能反映市场的实际情况,与有效市场假说相悖。因此(Altman,1967),提出了衡量金融投资风险的非线性分形理论。进一步(Peters,1994a)在Mandelbrot理论的基础上提出了分形市场假说(FMH)。他从实践的角度出发,把资本市场视为一个复杂的非线性动态系统,具有相互作用和自适应的特点。因此,FMH具有交互性和自适应性的特点,可以更好地描述市场的复杂性,分析市场价格波动的非线性动态特征,衡量信息对价格的影响,探索市场的可预测性。大量研究也表明,分形特征在金融市场中确实具有普遍性。
Furthermore, with the development of computer technology, machine learning algorithms, such as Decision Tree, Support Vector Machine (SVM) and Artificial Neural Network (ANN) came into being. With the further development of technology, the integration algorithm, which combines several weak learners into strong learners, has received more and more attention. The main ways to synthesize weak learners are bagging, boosting and stacking. For example, Random Forest is the representative of bagging algorithm, and Extreme Gradient Boosting (XGBoost) is a boosting algorithm. Machine learning models have been widely used in the research of risk prediction due to their outstanding advantages in dealing with nonlinear complex systems.
此外,随着计算机技术的发展,决策树、支持向量机(SVM)和人工神经网络(ANN)等机器学习算法应运而生。随着技术的进一步发展,将多个弱学习器组合成强学习器的集成算法受到越来越多的关注。综合弱学习器的主要方式有 bagging、boosting 和 stacking。例如,随机森林是bagging算法的代表,极限梯度提升(XGBoost)是boosting算法。机器学习模型因其在处理非线性复杂系统方面的突出优势而被广泛应用于风险预测的研究中。
Taking China’s crude oil futures market as the research object, this paper introduces the multifractal feature parameters into the machine learning model, and carries out risk status recognition and prediction of China’s crude oil futures market. In the turbulent economic situation, futures with its unique hedging function is favored by more and more investors, and has become a crisis management means to deal with the economic recession. By predicting the risk of China’s crude oil futures market, relevant investors can find the potential risk in advance and formulate preventive and control measures in time, so as to avoid the risk reasonably and reduce the loss to a large extent.
以中国原油期货市场为研究对象,将多重分形特征参数引入机器学习模型,对中国原油期货市场进行风险状态识别与预测。在动荡的经济形势下,期货以其独特的避险功能受到越来越多投资者的青睐,成为应对经济衰退的危机管理手段。通过预测我国原油期货市场的风险,相关投资者可以提前发现潜在风险,及时制定防控措施,合理规避风险,很大程度上减少损失。
Literature Review 文献综述
Existing relevant literature mainly focuses on four aspects, namely, the characteristics of crude oil futures, multifractal method, multifractal spectrum parameters and financial market risk prediction.
现有相关文献主要集中在原油期货特征、多重分形方法、多重分形谱参数和金融市场风险预测四个方面。
The first is to study the risk features of crude oil futures. At present, more and more scholars study China’s crude oil futures, China’s crude oil market environment and oil policy. Sun et al. (2018) used GARCH and TARCH models to study the fluctuation characteristics of China’s crude oil futures returns rate based on high-frequency data, and they found that the changes of China’s crude oil futures returns rate in the current as well as the lag period were mainly influenced by itself, and the influence coefficient of one period lag was larger and the influence time was longer. Ji and Zhang (2019) analyzed the initial characteristics of China’s crude oil futures market, laying a good foundation for subsequent studies. Li et al. (2019) proposes a new, novel crude oil price forecasting method based on online media text mining, with the aim of capturing the more immediate market antecedents of price fluctuations, the empirical results suggest that the proposed topic-sentiment synthesis forecasting models perform better than the older benchmark models. Liu et al. (2019a) constructed Copula-POT-CoVaR model to study the Risk Spillover Effect of crude oil market on BRIC stock markets, and found that there was significant risk spillover. Özdurak (2021) constructed DCC-GARCH model to study the spillover effect of crude oil price on clean energy investment, and found that with the rise of oil price, renewable energy investment will also tend to decrease. Weng et al. (2021) proposed a modeling framework, genetic algorithm regularization online extreme learning machine with forgetting factor (GA-RFOS-ELM), to estimate the effects of news during the COVID-19 pandemic on the volatility of crude oil futures which could be effective and efficient in volatility forecasting of crude oil futures.
一是研究原油期货的风险特征。目前,越来越多的学者研究中国原油期货、中国原油市场环境和石油政策。孙等人。 (2018)基于高频数据,利用GARCH和TARCH模型研究了我国原油期货收益率的波动特征,发现我国原油期货收益率在当期和滞后期的变化情况如下:主要受自身影响,滞后一期的影响系数较大,影响时间较长。 Ji和Zhang(2019)分析了中国原油期货市场的初步特征,为后续研究奠定了良好的基础。李等人。 (2019)提出了一种基于在线媒体文本挖掘的新型原油价格预测方法,旨在捕捉更直接的价格波动市场前因,实证结果表明,所提出的主题情感综合预测模型的表现优于较旧的基准模型。刘等人。 (2019a)构建Copula-POT-CoVaR模型研究原油市场对金砖四国股市的风险溢出效应,发现存在显着的风险溢出。 Özdurak(2021)构建DCC-GARCH模型研究原油价格对清洁能源投资的溢出效应,发现随着油价上涨,可再生能源投资也会趋于减少。翁等人。 (2021)提出了一种建模框架,即带有遗忘因子的遗传算法正则化在线极限学习机(GA-RFOS-ELM),用于估计 COVID-19 大流行期间新闻对原油期货波动性的影响,该框架可能是有效且有效的。有效地预测原油期货的波动性。
The second is to study the multifractal method. Since the traditional efficient market theory does not conform to the objective facts, Mandelbrot (Altman, 1967) first proposed the concept of fractal in the 1970s. On this basis, Peters (1994a) proposed the fractal market hypothesis (FMH). R/S method was first proposed by Hurst in hydrological analysis in 1951, and was first used in the analysis of financial time series by Mandelbrot (Mandelbrot and Wheeler, 1983) in 1983. However, the research of Lo (1989) and Peters (1994b), Peters (1996) found that the length of sample interval and the short-term correlation of samples will affect the analysis results of R/s method. In order to solve this defect, Peng et al. (1994) proposed detrended fluctuation analysis (DFA) when studying the chimeric tissue of DNA, which distinguishes local correlation from long-term correlation, so as to remove the pseudo correlation phenomenon, and can effectively analyze the long-term power-law correlation of unstable time series, which is widely used in financial time series analysis. On this basis (Kantelhardt et al., 2002), generalized the DFA method and obtained the multifractal detrended fluctuation analysis (MF-DFA) method. In 2008, podobnik and Stanley (Podobnik and Stanley, 2008; Podobnik et al., 2009) formed detrended cross correlation analysis (DCCA) on DFA method, which expanded it into a method that can measure the long-term correlation of two non-stationary time series. Jiang and Zhou (2011) and others further improved the MF-DCCA method and proposed multifractal detrended moving average correlation analysis (MF-X-DMA) (Wang et al., 2012). Combined statistical moment with multifractal cross-correlation analysis to test the cross multifractality between the two sequences. Ruan et al. (2016) used the price and trading volume data of gold spot and futures to study the cross-correlation and time-varying characteristics of price and trading volume. Zhang et al. (2019) and others studied the multifractal characteristics of bitcoin market with MF-DCCA, and further analyzed the multifractal correlation between bitcoin price and other financial market prices. Feng and Cao (2022) used multifractal detrended cross-correlation analysis (MF-X-DFA) and multifractal detrended partial cross-correlation analysis (MF-DPXA) to explore the fluctuation characteristics of cross-correlation between China and the United States agricultural futures market before and after canceling the price of West Texas medium crude oil futures, as well as the impact and cross-correlation on the market.
二是研究多重分形方法。由于传统的有效市场理论不符合客观事实,Mandelbrot(Altman,1967)在20世纪70年代首先提出了分形的概念。在此基础上,Peters(1994a)提出了分形市场假说(FMH)。 R/S方法最早由Hurst于1951年在水文分析中提出,并于1983年由Mandelbrot首次用于金融时间序列分析(Mandelbrot and Wheeler,1983)。但Lo(1989)和Peters( 1994b)、Peters(1996)发现样本间隔的长度和样本的短期相关性会影响R/s方法的分析结果。为了解决这个缺陷,Peng 等人。 (1994)在研究DNA嵌合组织时提出去趋势波动分析(DFA),区分局部相关性和长期相关性,从而去除伪相关现象,可以有效分析DNA的长期幂律相关性不稳定时间序列,广泛应用于金融时间序列分析。在此基础上(Kantelhardt等,2002),推广了DFA方法,得到了多重分形去趋势波动分析(MF-DFA)方法。 2008年,Podobnik和Stanley(Podobnik and Stanley,2008;Podobnik et al.,2009)在DFA方法的基础上形成了去趋势互相关分析(DCCA),将其扩展为可以衡量两个非长期相关性的方法。平稳时间序列。 Jiang和Zhou(2011)等人进一步改进了MF-DCCA方法,提出了多重分形去趋势移动平均相关分析(MF-X-DMA)(Wang等,2012)。结合统计矩与多重分形互相关分析来检验两个序列之间的交叉多重分形。 阮等人。 (2016)利用黄金现货和期货的价格和交易量数据,研究了价格和交易量的互相关性和时变特征。张等人。 (2019)等人利用MF-DCCA研究了比特币市场的多重分形特征,并进一步分析了比特币价格与其他金融市场价格之间的多重分形相关性。 Feng和Cao(2022)利用多重分形去趋势互相关分析(MF-X-DFA)和多重分形去趋势部分互相关分析(MF-DPXA)探讨了中美农产品期货互相关的波动特征取消西德克萨斯中质原油期货价格前后的市场情况,以及对市场的影响和相互关联。
The third is to study the multifractal spectrum parameters. In the field of engineering, multifractals are mostly used to extract the characteristics of signals, and then the extracted parameters are used in the research of signal recognition and classification. Li and Xie (2013) identified the multifractal spectrum characteristics of radar signals and discussed the identification mechanism of multifractal spectrum parameters. The empirical study shows that the feature parameters are effective to recognize signals. Li et al. (2020a) verified the validity of multifractal spectral parameters by analyzing the multifractal features of friction signals and quantitatively describing the friction vibration characteristics under different friction states through the calculated spectral parameters. In the field of finance, multifractal parameters have also been widely used. Sun et al. (2001) found that the main parameter
三是研究多重分形谱参数。在工程领域,多重分形多用于提取信号的特征,然后将提取的参数用于信号识别和分类的研究。 Li和Xie(2013)识别了雷达信号的多重分形谱特征,并讨论了多重分形谱参数的识别机制。实证研究表明,特征参数对于信号识别是有效的。李等人。 (2020a)通过分析摩擦信号的多重分形特征,验证了多重分形谱参数的有效性,并通过计算的谱参数定量描述了不同摩擦状态下的摩擦振动特性。在金融领域,多重分形参数也得到了广泛的应用。孙等人。 (2001)发现多重分形谱的主要参数 与恒生指数的日收益率直接相关。为了更好地利用多重分形谱中的统计信息(Wei和Huang,2005),构建了一种新的市场风险度量方法,该方法包含了多重分形谱参数的综合信息 。经过理论和实证研究,他们认为多重分形参数方法是研究金融市场价格波动的有力工具,从中可以获得大量的统计信息,有助于我们理解金融市场的复杂性。袁等人。 (2009)利用MF-DFA研究了上证指数日收益率的多重分形特征,并利用了上证指数日收益率的极差( )和标准差( )衡量证券市场风险的广义赫斯特指数。他们认为 和 越大,多重分形强度越大,市场风险越大。实证结果表明该风险衡量指标对于中国股市风险衡量是合理的。 Zhu和Zhang(2018)利用MF-DFA分析了中国股票市场的多重分形结构,发现多重分形谱的形状和宽度与阶数有关。通过进一步研究,他们发现多重分形参数在风险预测中发挥着重要作用。
The fourth aspect is the financial market risk prediction research. At present, the risk prediction models of financial market can be divided into two categories: one is the statistical approach, which mainly includes linear models such as univariate, multivariate and logistic regression. The idea of multivariate linear early warning model was first proposed by (Altman, 1967), whose Z-score model is the most classic and representative linear risk prediction model at present. Dong et al. (2019) use the CAViaR method to forecast the oil return risks, and further depict the dynamic and heterogeneous features during the crisis (or non-crisis) period, as well as in different markets via DCC-GARCH models. Latunde et al. (2020) uses the CAPM and some statistical tools (variance, covariance and mean) to study risks on the expected return of investing in four common Deutsche Bank (DB) crude oil assets, the result reveals that DTO-DB Crude oil Double Short has the highest beta risk and highest expected return. And the higher the risk, the higher the expected return, and vice versa, that is, the risk is directly proportional to the expected return. Liu et al. (2019b) extend the Copula-CoVaR models by introducing the Peak-over-Threshold and construct the Copula-POT-CoVaR model to investigate the risk spillover effect from crude oil market to BRICS stock markets. By using the crude oil market and BRICS stock market data from 2006 to 2016 as the sample, the empirical study results show that: there is a significant risk spillover from crude oil market to BRICS stock markets, and the risk of crude oil market explains more than 50 percent of BRICS stock markets’ risk. Li et al. (2021) use the Conditional Autoregressive Value at Risk models (CAViaR) approach to forecast the risk of Bitcoin’s returns, the results show that Bitcoin’s volatility is significantly related to the volatility of the crypto-asset’s return and the main determinants of volatility are speculation, investor attention, market interoperability and the interaction between speculation and market interoperability. Li et al. (2020b) measure the return risks of the cryptocurrencies by using the CAViaR model, the results show that they have similar risk tendencies, the risk spillover directions are highly correlative with the market capitalizations of the cryptocurrencies. However, the statistical approach, which mainly includes linear models, is difficult to describe the nonlinear relationship in the financial market. The second category is the machine learning approach. With the rapid development of machine learning algorithms, many scholars begin to combine computer technology with relevant knowledge of financial markets to do interdisciplinary research on the risk prediction of financial markets, with algorithms such as Support Vector Machine (SVM) and Extreme Gradient Boost (XGBoost). Tam and Kiang (1990) compared the neural network model and the traditional statistical model in predicting the risks of banks, and he found that the prediction accuracy of the BP (back propagation) neural network was higher. Later, in order to make the results more reliable (Tam, 1991), compared the prediction results of the BP neural network with those of other algorithms (such as logistic regression, decision tree and feed-forward artificial neural network), and he found that the prediction effect of the BP neural network was the best. Uthayakumar et al. (2020) proposed a cluster-based classification model, including improved K-means clustering and fitness-scaling chaotic genetic ant colony algorithm (FSCGACA) classification model to predict financial crises. Zhao et al. (2018) used least squares support vector machine (LSSVM) to predict systemic financial risks, and Particle Swarm Optimization (PSO) was used to optimize the parameters of the model, and the results show that LSSVM is better at accurate prediction and generalization. Ma and Lv (2019) took the objective function of machine learning algorithms such as support vector machine and neural network as the basis function to carry out the weighted average, and used the constructed Multi-Lingual Information Access (MLIA) model to predict the credit risk of Internet finance. The empirical results show that this model has a higher prediction accuracy compared with logistic regression. Li and Quan (2019) used BP neural network to predict the financial risks of manufacturing enterprises, optimized the model parameters by using improved particle swarm optimization (IPSO), and established a financial risk prediction model based on the IPSOBP model.
第四方面是金融市场风险预测研究。目前,金融市场风险预测模型可分为两类:一类是统计方法,主要包括单变量、多元、逻辑回归等线性模型。多元线性预警模型的思想最早由(Altman,1967)提出,其Z-score模型是目前最经典、最具代表性的线性风险预测模型。董等人。 (2019)利用CAViaR方法预测回油风险,并通过DCC-GARCH模型进一步刻画危机(或非危机)期间以及不同市场的动态和异质特征。拉通德等人。 (2020)利用CAPM和一些统计工具(方差、协方差和均值)研究了投资德意志银行(DB)四种常见原油资产的预期回报的风险,结果表明DTO-DB原油双重空头具有最高的贝塔风险和最高的预期回报。并且风险越高,预期收益就越高,反之亦然,即风险与预期收益成正比。刘等人。 (2019b) 通过引入 Peak-over-Threshold 来扩展 Copula-CoVaR 模型,构建 Copula-POT-CoVaR 模型来研究原油市场对金砖国家股票市场的风险溢出效应。以2006-2016年原油市场和金砖国家股票市场数据为样本,实证研究结果表明:原油市场对金砖国家股票市场存在显着的风险溢出,原油市场的风险更多地解释了金砖国家股票市场的风险。金砖国家股市风险的50%以上。李等人。 (2021)使用条件自回归风险价值模型(CAViaR)方法来预测比特币收益的风险,结果表明比特币的波动性与加密资产收益的波动性显着相关,而波动性的主要决定因素是投机,投资者注意力、市场互操作性以及投机与市场互操作性之间的相互作用。李等人。 (2020b)利用CAViaR模型衡量加密货币的收益风险,结果表明它们具有相似的风险倾向,风险溢出方向与加密货币的市值高度相关。然而,主要包括线性模型的统计方法很难描述金融市场中的非线性关系。第二类是机器学习方法。随着机器学习算法的快速发展,许多学者开始将计算机技术与金融市场的相关知识相结合,对金融市场的风险预测进行跨学科研究,例如支持向量机(SVM)、极限梯度提升(XGBoost)等算法。 )。 Tam和Kiang(1990)比较了神经网络模型和传统统计模型在预测银行风险方面的作用,他发现BP(反向传播)神经网络的预测精度更高。后来,为了使结果更加可靠(Tam,1991),将BP神经网络的预测结果与其他算法(如逻辑回归、决策树和前馈人工神经网络)的预测结果进行了比较,发现可见BP神经网络的预测效果最好。乌达雅古玛等人。 (2020)提出了一种基于聚类的分类模型,包括改进的 K 均值聚类和适应度缩放混沌遗传蚁群算法 (FSCGACA) 分类模型来预测金融危机。赵等人。 (2018)使用最小二乘支持向量机(LSSVM)来预测系统性金融风险,并使用粒子群优化(PSO)来优化模型参数,结果表明LSSVM具有更好的准确预测和泛化能力。 Ma和Lv(2019)以支持向量机、神经网络等机器学习算法的目标函数为基函数进行加权平均,并利用构建的多语言信息访问(MLIA)模型来预测信用互联网金融风险。实证结果表明,与逻辑回归相比,该模型具有更高的预测精度。 Li和Quan(2019)利用BP神经网络预测制造企业的财务风险,并利用改进的粒子群优化(IPSO)优化模型参数,建立了基于IPSOBP模型的财务风险预测模型。
Throughout the above literature, although the existing literature has carried out a large number of studies on the multifractal theory and analysis methods, multifractal spectrum parameters and risk prediction models, there is still room for further research. ① Since China’s crude oil futures market is an emerging market, there are few studies on it at present. Most of the existing research focus on price fluctuations of China’s crude oil futures, or comparison with other markets through econometric models by studying the co-integration relationship, Granger causality relationship or linkage effect between markets. Although (Wang et al., 2011) introduced the multifractal method into the research of China’s crude oil futures market, they did not study the risk of this market from the perspective of multifractal spectrum parameters. ② A large number of existing studies focus on the confirmation and generation mechanism of multifractal features of financial markets, but the achievements of fractal theories applied to financial markets are relatively scattered. Although some scholars have substituted the fractal indirect index (fractal spectral parameter) for variance to measure the financial market risk, there are few studies that combine the multi-fractal parameters with clustering algorithm to carry out pattern recognition of market risk. ③ Although the machine learning method has been introduced into the research of financial market risk prediction, it mainly focuses on the analysis and measurement of the overall risk of the market, instead of using the multi-fractal parameters to predict the risk status of the financial market from the perspective of the multifractal features. In this paper, therefore, with China’s crude oil futures as the research object, we employ the multifractal theory framework and introduce multifractal feature parameters into the machine learning model to identify and predict China’s oil futures market risk, so as to provide relevant investors a more effective reference for risk management by helping them identify potential risks in advance and promptly formulate prevention and control measures.
纵观上述文献,虽然现有文献对多重分形理论与分析方法、多重分形谱参数和风险预测模型进行了大量的研究,但仍有进一步研究的空间。 ①由于我国原油期货市场是一个新兴市场,目前对其的研究还很少。现有研究大多集中于中国原油期货价格波动,或通过计量经济模型与其他市场进行比较,研究市场之间的协整关系、格兰杰因果关系或联动效应。虽然(Wang等,2011)将多重分形方法引入到我国原油期货市场的研究中,但并没有从多重分形谱参数的角度来研究该市场的风险。 ②现有大量研究集中在金融市场多重分形特征的确认和生成机制上,但分形理论应用于金融市场的成果相对分散。尽管有学者用分形间接指数(分形谱参数)代替方差来衡量金融市场风险,但将多重分形参数与聚类算法相结合进行市场风险模式识别的研究还很少。 ③虽然机器学习方法已被引入金融市场风险预测的研究中,但主要侧重于对市场整体风险的分析和衡量,并没有利用多重分形参数来预测金融市场的风险状况。从多重分形特征的角度看市场。 因此,本文以中国原油期货为研究对象,采用多重分形理论框架,将多重分形特征参数引入到机器学习模型中,对中国石油期货市场风险进行识别和预测,为相关投资者提供更多信息。帮助企业提前识别潜在风险,及时制定防控措施,为风险管理提供有效参考。
The marginal contribution of this paper is mainly reflected in the following two aspects. First, this paper studies the multifractal features of China’s crude oil futures market from the perspective of high frequency. This paper calculates the intra-day multifractal spectrum parameters through the improved EMD-MFDFA method, and combines it with the unsupervised clustering algorithm to identify as well as define the risk status of the market in each trading day. Second, this paper adopts SVM and XGBoost as well as their improved algorithms based on sample imbalance issue to predict the risk status of China’s crude oil futures market, so that relevant investors can identify potential risks in advance and formulate prevention and control measures in time.
本文的边际贡献主要体现在以下两个方面。首先,本文从高频角度研究了我国原油期货市场的多重分形特征。本文通过改进的EMD-MFDFA方法计算日内多重分形谱参数,并与无监督聚类算法相结合,识别和定义每个交易日市场的风险状态。其次,本文采用SVM和XGBoost及其基于样本不平衡问题的改进算法来预测我国原油期货市场的风险状况,以便相关投资者提前识别潜在风险并及时制定防控措施。
The overall framework of this paper is as follows: Section 3 analyzes the risk characteristics of China’s crude oil futures market, providing sample data for the risk prediction of energy futures market; Section 4 identifies and measures the risk of China’s crude oil futures market; Section 5 is about the risk prediction of China’s crude oil futures market. The main conclusions of this paper are in Section 6.
本文的总体框架如下:第三节分析了我国原油期货市场的风险特征,为能源期货市场的风险预测提供样本数据;第四节识别和衡量我国原油期货市场的风险;第五节是我国原油期货市场的风险预测。本文的主要结论在第 6 节。
Risk Features of China’s Crude Oil Futures Market
中国原油期货市场风险特征
Data Sources and Basic Analysis of China’s Crude Oil Futures Market
中国原油期货市场数据来源及基本分析
This paper selects China’s crude oil futures issued in March 2018 as the research object, and the sample data time span is from 26 March 2018 to 1 March 2021, with a total of 73,575 5-min high-frequency trading records of 712 trading days (excluding weekends and holidays; data are from Shanghai Futures Exchange). Data collection starts at 21:00 p.m. on the day before trading and ends at 15:00 p.m. on the day of trading, recording once every 5 min, then 111 pieces of data can be collected on each trading day (Note: the trading time of each trading day is 21:00-02:30, 09:00-11:30, 13:30-15:00).
本文选取2018年3月发行的我国原油期货为研究对象,样本数据时间跨度为2018年3月26日至2021年3月1日,共712个交易日的73,575条5分钟高频交易记录(不含周末和节假日;数据来自上海期货交易所)。数据收集于晚上 21:00 开始。交易前一天至下午 15:00 结束交易当天,每5分钟记录一次,则每个交易日可采集111条数据(注:每个交易日的交易时间为21:00-02:30、09:00-11:30) , 13:30-15:00)。
This paper defines the logarithmic return rate as:
本文将对数收益率定义为: ,其中 表示 时刻中国原油期货市场的收盘价。图1为我国原油期货收盘价波动情况及相应收益率。从图中可以看出,2018年末我国原油期货价格大幅下跌,甚至抹去了年初以来的全部涨幅。造成这种情况的可能原因是国际原油需求增长疲弱,但供给却大幅增加,导致供需失衡。其次,油价前期的快速上涨对经济社会产生了负面影响(高油价导致经济衰退,进而引发一系列社会动荡),从而导致油价持续下跌。同样,2019年底至2020年初,受全球COVID-19疫情影响,原油出口和储存受阻,导致油价持续大幅下跌,相应收益波动加大与其他时期相比显着,且存在明显的波动聚集现象。
FIGURE 1. Time series of China’s crude oil futures market price and return rate.
图1.中国原油期货市场价格和收益率的时间序列。
In addition, Table 1 displays the descriptive statistics of sample data. The series skewness and kurtosis shown in the table are obviously not zero, indicating obvious non-normality of both the price series and the return rate series. Specifically, the skewness values of price and returns are both less than 0, and the kurtosis values are greater than 0. According to the skewness value, the distribution of the return rate series is slightly to the left. The kurtosis value indicates that the return rate series presents the characteristic of sharp peak and thick tail. What’s more, the Jarque-Bena (JB) statistic is used to test the normality of the sequence, and it is found that the JB statistic is relatively large, which indicates that the hypothesis of the sequence obeying normal distribution is rejected at the 1% confidence level.
此外,表1显示了样本数据的描述性统计。表中显示的序列偏度和峰度明显不为零,表明价格序列和收益率序列都存在明显的非正态性。具体来说,价格和收益的偏度值均小于0,且峰度值大于0。从偏度值来看,收益率序列的分布略偏左。峰度值表明收益率序列呈现尖峰粗尾的特征。另外,使用Jarque-Bena(JB)统计量来检验序列的正态性,发现JB统计量比较大,这说明序列服从正态分布的假设在1%处被拒绝了。置信水平。

TABLE 1. Descriptive statistics of data.
表 1. 数据的描述性统计。
Multifractal Features of China’s Crude Oil Futures Market
中国原油期货市场的多重分形特征
Although the MF-DFA method can effectively analyze the multifractal features of non-stationary time series, there are still some shortcomings in this method. Firstly, the MF-DFA method requires the time series to be detrended. Specifically, it is found that when the MF-DFA method is used to segment the whole sequence, the segmented interval length is not always an integral multiple of the original sequence length, so the segmented interval is not always continuous. This uncertainty will lead to the discontinuity of the fitting polynomials of adjacent segmented intervals, which may produce new pseudo-random fluctuation error, and then make the fluctuation function produce a certain deviation, resulting in the distortion of the scale index. Therefore, in this paper, the sliding-window method is adopted to improve the discontinuity problem of the segmented interval, so that the segmentation of the non-overlapping interval is optimized into continuous overlapping interval, and the error caused by the discontinuity of the segmented interval is avoided. Secondly, in the MF-DFA method, the polynomial fitting method is used to estimate the local trend of the sequence, and each interval should be de-trended. But the polynomial fitting needs to determine the order of polynomial artificially in advance, and there is no certain standard for the choice of order, so it is subject to great random interference. Therefore, this paper combines the empirical mode decomposition (EMD) with multifractal detrended fluctuation analysis to improve the shortcomings of MF-DFA. The improved EMD-MFDFA method eliminates the trend term extracted by empirical mode decomposition from the original series, so as to eliminate the trend in the time series and avoid the error caused by the unfixed order of polynomial fitting.
虽然MF-DFA方法可以有效地分析非平稳时间序列的多重分形特征,但该方法仍然存在一些缺点。首先,MF-DFA方法需要对时间序列进行去趋势处理。具体地,发现当采用MF-DFA方法对整个序列进行分割时,分割后的区间长度并不总是原始序列长度的整数倍,因此分割后的区间并不总是连续的。这种不确定性会导致相邻分段区间的拟合多项式不连续,可能产生新的伪随机波动误差,进而使波动函数产生一定的偏差,导致尺度指标的畸变。因此,本文采用滑动窗口方法来改善分段区间的不连续性问题,使非重叠区间的分段优化为连续重叠区间,并且消除了分段区间不连续性带来的误差。避免了间隔。其次,在MF-DFA方法中,采用多项式拟合方法来估计序列的局部趋势,并且每个区间都要进行去趋势处理。但多项式拟合需要预先人为确定多项式的阶数,阶数的选择没有一定的标准,因此受到很大的随机干扰。因此,本文将经验模态分解(EMD)与多重分形去趋势波动分析相结合,以改进MF-DFA的缺点。 改进的EMD-MFDFA方法消除了原始序列中经验模态分解提取的趋势项,从而消除了时间序列中的趋势,避免了多项式拟合阶数不固定带来的误差。
To sum up, this paper combines the advantages of the sliding-window technology and the EMD method to improve the original MF-DFA method, and uses the improved EMD-MFDFA method to analyze the multifractal features of the return rate series of China’s crude oil futures market, which are shown in Figure 2.
综上所述,本文结合滑动窗口技术和 EMD 方法的优点对原有的 MF-DFA 方法进行改进,并利用改进的 EMD-MFDFA 方法分析了中国原油回油率序列的多重分形特征。期货市场,如图2所示。
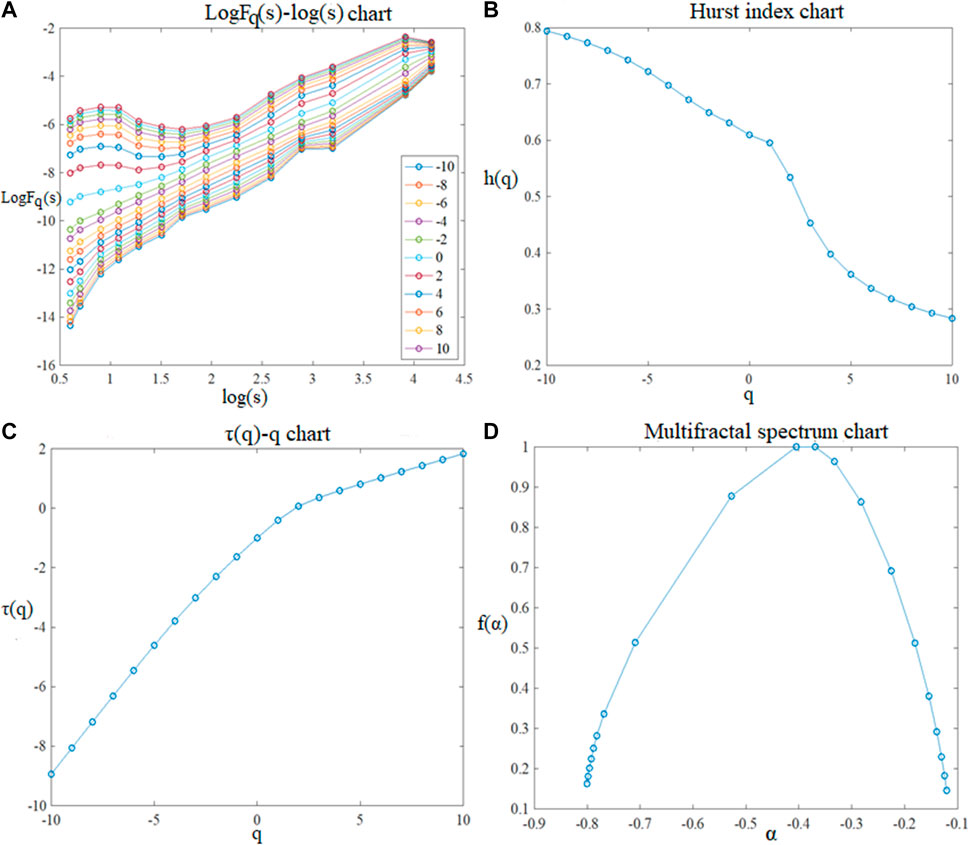
FIGURE 2. Multifractal features analysis of China’s crude oil futures market with the EMD-MFDFA.
图 2. 使用 EMD-MFDFA 对中国原油期货市场进行多重分形特征分析。
The following conclusions can be drawn from Figure 2:
从图2可以得出以下结论:
① Figure2A shows the double logarithm relationship between the scale s and the fluctuation function
① 图2A给出了不同 取值时尺度s与涨落函数 (q阶波函数)之间的双对数关系。显然,当s增大到一定程度时,波动函数 大致呈线性增大,这表明我国原油期货市场收益率序列具有明显的幂律相关性和长期相关性。需要注意的是,上述线性关系在s=23时发生变化,23对应大约1个月,这与大多数金融市场的结果一致。
② As is known to all, when the value of
②众所周知,当 (广义赫斯特指数)的值随 的值变化时,序列将呈现多重分形特征,否则,将呈现多重分形特征。单一分形特征。从图2B可以看出,当 的值从-10变化到10时,收益率序列 从0.7932减小到0.2748,表明收益率序列我国原油期货市场具有明显的多重分形特征。具体来说,当订单 为较大正数时,反映了价格序列中较大波动成分的行为信息。本例中为 ,表明大幅波动呈现反持续特征,更容易出现趋势变化。但当订单数 较小或为负数时,价格序列的小波动成分被放大,此时 ,表明小波动表现出一定的波动性。坚持的程度。另外,当 时,此时的 就是传统的 Hurst 指数。根据实验结果, 大于0.5,表明市场具有长期记忆特征。因此,我国原油期货市场具有较为明显的长期记忆特征。
③ It can also be seen from Figure 2C that there is an obvious nonlinear relationship between the Renyi index
③ 从图2C还可以看出,我国原油期货收益率序列的人益指数 (多重分形标度指数)与 之间存在明显的非线性关系市场;图像呈现为递增凸函数,进一步验证了该序列的多重分形特征。
④ Figure 2D shows the multifractal spectrum of the sequence. It can be seen from the figure that the multifractal spectrum changes with
④ 图2D 显示了序列的多重分形谱。从图中可以看出,多重分形谱随 变化,呈现出明显的拱形形状, 值在-0.8134~-0.1142之间,表明存在该序列中的多重分形特征。
The above analysis of the generalized Hurst index and multifractal spectrum is only a direct and qualitative analysis on multifractal features. On this basis, we also need to carry out quantitative analysis to accurately describe the multifractal degree. Because the multifractal parameters
上述对广义赫斯特指数和多重分形谱的分析只是对多重分形特征的直接定性分析。在此基础上,我们还需要进行定量分析,以准确描述多重分形程度。由于多重分形参数 和 可以揭示序列的波动状态,衡量序列多重分形特征的强度,因此我们用这两个指标来量化多重分形程度中国原油期货市场交易价格系列。 和 的计算公式如下:
Since
由于 可以用来反映该序列的波动方式和相对幅度,而 则代表金融时间序列趋势分布的离散程度,因此可以用它们来表示测量序列波动的绝对范围。从表2可以看出,多重分形参数 和 的值分别为0.5184和0.6993,表明波动变化的相对幅度和绝对幅度该级数的值越大,即该级数的多重分形度越大。
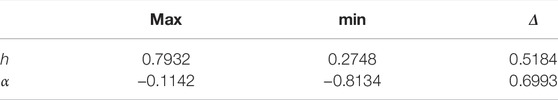
TABLE 2. Multifractal parameters
表 2. 多重分形参数 和 。
Risk Identification and Measurement of China’s Crude Oil Futures Market
中国原油期货市场风险识别与衡量
Risk Identification of China’s Crude Oil Futures Market Based on Fractal Characteristics
基于分形特征的中国原油期货市场风险识别
The price fluctuation of China’s crude oil futures market has obvious multifractal characteristics. On this basis, this paper divides the whole sample data into daily trading data and calculates the daily multifractal spectrum parameters, so as to effectively identify the daily risk pattern of the market. In order to make the research more rigorous, this paper first analyzes the multifractal features of each trading-day series with the EMD-MFDFA by selecting a trading day at random, and the results are shown in Figure 3.
我国原油期货市场价格波动具有明显的多重分形特征。在此基础上,本文将整个样本数据划分为每日交易数据并计算每日多重分形谱参数,从而有效识别市场每日风险模式。为了使研究更加严谨,本文首先通过随机选择一个交易日,用EMD-MFDFA分析每个交易日序列的多重分形特征,结果如图3所示。
FIGURE 3. Multifractal analysis of the return rate of China’s crude oil futures market under day granularity (taking 2018/05/24 as an example).
图3.日粒度下中国原油期货市场收益率的多重分形分析(以2018年5月24日为例)。
Taking the 5-min high-frequency trading data on 24 May 2018 as an example, the double logarithm graph and multifractal spectrum are drawn. It can be seen from Figure 3A that the daily return rate series of China’s crude oil futures market has obvious power-law relationship under different
以2018年5月24日5分钟高频交易数据为例,绘制双对数图和多重分形谱。从图3A可以看出,我国原油期货市场日收益率序列在不同 值下具有明显的幂律关系,即具有多重分形特征。此外,多重分形谱图3B也显示出明显的拱形形状,这与整体多重分形结果一致。值得注意的是,其他交易日也有类似表现。因此,我们发现我国原油期货的日价格波动也具有多重分形特征。值得一提的是,多重分形参数是根据当日交易的5分钟高频数据计算得出的,因此可以覆盖当日的大部分交易信息。与每日收盘价对应的收益率相比,多重分形参数定义的风险状态更加真实可靠。因此,本文进一步对日常多重分形谱参数进行分析。
The definition of
上面已经给出了分形谱宽度 的定义,也定义了相应的参数 。根据配分函数方法, 和 分别表示最小概率测度和最大概率测度。 越大,多重分形谱越宽,表明当日价格分布越不均匀,波动的绝对幅度越大。由于 和 具有相同的概率度量,因此存在相应的参数 和 。 代表序列趋势高于平均值的可能性, 代表序列趋势低于平均值的可能性,因此可以使用 衡量一定时间内序列的均匀性和复杂性。由于 有自己的标志,当 出现时,表明价格长期处于均线上方,投资者认为价格走势良好;否则,当 价格低于平均水平时,投资者认为市场疲软。一般来说, 的绝对值越大,时间序列分布越不均匀,波动状态越复杂。
To sum up,
综上所述, 可以用来衡量一天内价格波动的绝对幅度, 可以用来衡量价格波动的相对趋势高度和复杂程度。因此,本文将进一步分析我国原油期货收益率序列的日多重分形特征,为准确界定市场正常状态和风险状态提供数据支撑。计算出各交易日的多重分形谱参数后,绘制散点图,如图4所示。
FIGURE 4. Scatter diagram of
图 4. 的散点图。
Obviously, the data distribution in the lower left corner of the figure is relatively concentrated. In combination with the above theoretical analysis, it can be seen that the larger the values of
显然,图中左下角的数据分布比较集中。结合上述理论分析可以看出, 和 的值越大,序列的波动越大,序列的复杂度越高。波动是,反之亦然。因此,图4左下角的样本点表明该交易日市场处于正常状态。为了使市场日常风险状态的识别更加准确,本文引入无监督聚类算法,在不设置 和 阈值的情况下,考虑人为随机干扰的影响避免了风险识别。
In this paper, the K-means clustering and the Gaussian Mixture Model (GMM) are used to cluster the parameters
本文采用K均值聚类和高斯混合模型(GMM)对上面计算出的参数 和 进行聚类。
In short, the Gaussian Mixture Model (GMM) can be regarded as an optimization of the K-means algorithm. It is not only a kind of technical means commonly used in industry, but also belongs to a generation model. The GMM is to mix the probability distribution of multi-dimensional Gaussian model, so as to fit different sample data sets, so it has strong generalization ability and good fitting effect. In the K-means algorithm, the probability that the sample belongs to each cluster is qualitative, only “yes” or “no,” and the corresponding probability value cannot be output. The GMM method, on the other hand, gives the probability of these sample data points being assigned to each cluster, and it can assign samples to different clusters according to artificial threshold values. Therefore, the information obtained by the GMM method is more. Figure 5 shows the risk pattern recognition results with K-means clustering and GMM clustering algorithms for China’s crude oil futures market. It is also obvious from the clustering results in the figure that the results gathered by the GMM are more accurate and more in line with the actual situation of the market. Therefore, this paper uses the GMM algorithm to identify the risks of China’s crude oil futures market and defines the market risk status into two categories: the normal status and the risk status, providing a label basis for subsequent risk prediction model.
简而言之,高斯混合模型(GMM)可以看作是K-means算法的优化。它不仅是工业上常用的一种技术手段,而且属于一代机型。 GMM是将多维高斯模型的概率分布进行混合,从而拟合不同的样本数据集,因此泛化能力强,拟合效果好。在K-means算法中,样本属于每个簇的概率是定性的,只有“是”或“否”,无法输出对应的概率值。而GMM方法则给出了这些样本数据点被分配到每个簇的概率,它可以根据人为的阈值将样本分配到不同的簇。因此,GMM方法获得的信息更多。图5显示了K-means聚类和GMM聚类算法对中国原油期货市场的风险模式识别结果。从图中的聚类结果也可以明显看出,GMM得出的结果更加准确,也更加符合市场的实际情况。因此,本文采用GMM算法对我国原油期货市场风险进行识别,将市场风险状态定义为正常状态和风险状态两类,为后续风险预测模型提供标签依据。
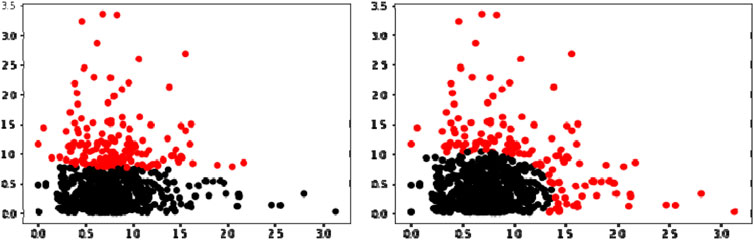
FIGURE 5. Risk identification of China’s crude oil futures market by K-means clustering (left) and GMM clustering (right).
图 5. K-means 聚类(左)和 GMM 聚类(右)对中国原油期货市场的风险识别。
Selection of Risk Feature Indicators
风险特征指标的选取
After obtaining the risk status indicator variables of China’s crude oil futures market, it is also necessary to select appropriate feature indicator variables for the market risk prediction model. Since there are many factors that affect market volatility, in order to get as much information as possible, this paper selects the risk feature indicators from two aspects: basic indicators and technical indicators.
在获得我国原油期货市场风险状况指标变量后,还需要为市场风险预测模型选择合适的特征指标变量。由于影响市场波动的因素较多,为了获得尽可能多的信息,本文从基本指标和技术指标两个方面选取风险特征指标。
To be specific, This paper selects eight basic indicators (open, high, low, close, volume, settle, pre_settle, return) and 16 technical indicators (MA5, MA10, MACD, SAR, BOP, ATR, MFI, MOM, K, D, J, ROCP, CCI, RSI, OBV, WILLR) as the eigenvectors of the prediction model. Among them, most of the technical indicators in this paper are calculated from the quantified transaction package Ta-Lib in Python. The basic meanings of indicators are shown in Table 3.
具体来说,本文选取了8个基本指标(开盘价、最高价、最低价、收盘价、成交量、结算、预结算、收益)和16个技术指标(MA5、MA10、MACD、SAR、BOP、ATR、MFI、MOM、K、 D、J、ROCP、CCI、RSI、OBV、WILLR)作为预测模型的特征向量。其中,本文大部分技术指标均由Python中的量化交易包Ta-Lib计算得出。指标基本含义如表3所示。
TABLE 3. Risk feature indicators.
表3.风险特征指标。
Data Processing 数据处理
Through the above analysis, this paper transforms and processes eight basic indicators to calculate 17 technical indicators, obtaining the feature indicator variables of China’s crude oil futures market in each trading day from 26 March 2018 to 1 March 2021; then, this paper combines the variables with the risk pattern recognition results (label index) in Section 4.2 to form a sample data set of risk prediction model. The feature indicators and the label indicators can be expressed as
通过上述分析,本文对8个基本指标进行变换处理,计算出17个技术指标,得到2018年3月26日至2021年3月1日各交易日中国原油期货市场的特征指标变量;然后,本文将变量与4.2节中的风险模式识别结果(标签索引)相结合,形成风险预测模型的样本数据集。特征指示符和标签指示符可以分别表示为 和 。具体地, 为交易日t对应的第 个特征指标; 表示第t个交易日对应的风险状态指标,取值为0或1(其中0表示市场处于正常状态,1表示市场处于风险状态)状态)。因此,特征指示变量和状态指示变量构成了本文的样本点( 、 )。又由于本文是对我国原油期货市场的风险进行预测,即通过当前时刻的特征指标变量来预测下一时刻的状态指标变量,那么预测模型中使用的样本数据集为( , )。
Because the selected feature indicators have different orders of magnitude, if they are not processed, the information extraction of the data will be incomplete, and the effect of the model will also be greatly affected. In order to narrow the magnitude gap among feature data and improve the accuracy of model prediction, this paper adopts the Min-Max method to normalize the sample feature data, that is, to make linear changes to the original feature data so that the processed data results can be mapped to a unified interval. The specific formula is as follows:
由于选取的特征指标数量级不同,如果不进行处理,就会导致数据的信息提取不完整,模型的效果也会受到很大影响。为了缩小特征数据之间的幅度差距,提高模型预测的准确性,本文采用Min-Max方法对样本特征数据进行归一化,即对原始特征数据进行线性改变,使得处理后的数据结果可以映射到统一的区间。具体公式如下:
After data normalization, the prediction accuracy and convergence speed of the model can be improved.
数据归一化后,可以提高模型的预测精度和收敛速度。
Screening of Risk Feature Indicators
风险特征指标筛选
The prediction model is a complex model with multiple indicators. Only by accurately extracting the feature vectors that affect market risks can we make the risk prediction more accurate. It is worth noting that many technical indicators are calculated based on the basic indicators, so the feature indicators we select may have obvious correlation between each other, and the information contained in one indicator may be relatively similar with another. Therefore, choosing more indicators will not make the model better, but will reduce the learning efficiency and increase the time cost of the model. At the same time, there may be some unclassifiable feature indicators in the initial ones. Thus, in order to simplify the complexity of the model and improve its prediction efficiency and accuracy, we need to further screen the selected initial feature indicators, so that the selected ones can contain the information of the majority of features, and achieve the effect of dimensionality reduction and denoising. Therefore, in order to extract the representative risk measurement indicators of China’s crude oil futures market from the initial indicators, this paper adopts the decision tree algorithm and calls the feature_importances interface in the decision tree model to obtain the importance of the features. This method mainly measures whether a feature is important or not from two aspects: first, the total number of features split; Second, the total (average) information gain from features. The more the total number of feature splits or the greater the total (average) information gain, the higher the importance of the feature is, and vice versa. In this paper, information gain will be used to calculate the importance of each feature, and the results are shown as follows:
预测模型是一个包含多个指标的复杂模型。只有准确提取影响市场风险的特征向量,才能使风险预测更加准确。值得注意的是,很多技术指标都是在基本指标的基础上计算出来的,因此我们选择的特征指标之间可能存在明显的相关性,一个指标所包含的信息可能与另一个指标相对相似。因此,选择更多的指标并不会让模型变得更好,反而会降低学习效率,增加模型的时间成本。同时,初始特征指标中可能存在一些无法分类的特征指标。因此,为了简化模型的复杂度,提高其预测效率和准确率,需要对选取的初始特征指标进行进一步筛选,使选取的特征指标能够包含大部分特征的信息,达到降维和去噪。因此,为了从初始指标中提取出我国原油期货市场具有代表性的风险衡量指标,本文采用决策树算法,调用决策树模型中的feature_importances接口来获取特征的重要性。该方法主要从两个方面来衡量一个特征是否重要:一是特征分割总数;二是特征分割总数。其次,特征的总(平均)信息增益。特征分裂总数越多或总(平均)信息增益越大,该特征的重要性越高,反之亦然。本文将利用信息增益来计算每个特征的重要性,结果如下所示:
In the decision tree construction, the larger the information gain of a feature, the stronger the ability of classification, that is, the higher the importance of the feature. Therefore, we need to select features with large information gain from the original features as the feature indicator variables. As can be seen from Figure 6, the top 10 variables of information gain are ATR, RSI, OBV, J, return, CCI, MACD, vol, MA_10 and MFI, so this paper takes them as the feature indicators in the risk prediction model of China’s crude oil futures market.
在决策树构建中,特征的信息增益越大,分类能力越强,即该特征的重要性越高。因此,我们需要选择对原始特征信息增益较大的特征作为特征指示变量。从图6可以看出,信息增益排名前10位的变量分别是ATR、RSI、OBV、J、return、CCI、MACD、vol、MA_10和MFI,因此本文将它们作为风险预测模型中的特征指标中国原油期货市场。
FIGURE 6. The importance ranking of feature indicator variables based on information gain.
图 6. 基于信息增益的特征指标变量的重要性排序。
Risk Prediction of China's Crude Oil Futures Market
中国原油期货市场风险预测
Risk Prediction Evaluation Criteria
风险预测评估标准
After the above data processing, this paper obtained a complete data set for risk prediction, including 10 characteristic indicators and label indicators obtained by multi-fractal spectral parameter clustering. According to the statistics, among the 691 trading days included in the sample, 550 trading days are in the normal state and 141 trading days are in the risk status. The proportion of risk samples and normal samples is close to 1:4, so the samples are unbalanced. Therefore, the accuracy of classification can not be used as an evaluation criterion of the quality of the model, and some other evaluation criteria are necessary to measure the training ability and generalization ability of the classification model. Based on the confusion matrix, this paper calculates two comprehensive evaluation indexes as model evaluation criteria to solve the problem of sample imbalance in this paper. The specific meaning of confusion matrix is shown in Table 4:
经过上述数据处理,本文获得了完整的风险预测数据集,包括多重分形谱参数聚类得到的10个特征指标和标签指标。据统计,样本纳入的691个交易日中,550个交易日处于正常状态,141个交易日处于风险状态。风险样本与正常样本的比例接近1:4,样本不平衡。因此,分类的准确率不能作为模型好坏的评价标准,还需要一些其他的评价标准来衡量分类模型的训练能力和泛化能力。本文基于混淆矩阵,计算两个综合评价指标作为模型评价标准,以解决本文样本不平衡的问题。混淆矩阵的具体含义如表4所示:
TABLE 4. The confusion matrix table.
表 4. 混淆矩阵表。
According to the results of the confusion matrix, the accuracy, precision, recall rate and specificity of the risk prediction model can be calculated. The specific meanings and formulas are as follows:
根据混淆矩阵的结果,可以计算出风险预测模型的准确率、精密度、召回率和特异性。具体含义及公式如下:
Accuracy: The proportion of all correctly predicted samples to the total number of samples.
准确率:所有正确预测的样本占样本总数的比例。
Precision: the proportion of true minorities in all samples predicted to be minorities.
精确度:真正的少数群体在所有预测为少数群体的样本中所占的比例。
Recall rate: The percentage of a sample that is actually a minority category that is predicted to be a minority category.
召回率:实际属于少数类别的样本被预测为少数类别的百分比。
Specificity: a measure of how many samples that are actually in the majority class are correctly predicted to be majority.
特异性:衡量实际属于多数类别的样本有多少被正确预测为多数类别的指标。
To sum up, there is a trade-off between accuracy and recall rate, and the balance between the two means that we should try not to miss the majority class while capturing the minority. Therefore, in order to meet the above requirements, the harmonic mean of the two is calculated as a comprehensive index and expressed by F1. According to the characteristics of the harmonic mean which tends to favor the index with a smaller value, when the accuracy and recall rate are both large, the closer the value of F1 is to 1, the better the classification effect of the model. The specific formula of F1 is as follows:
综上所述,准确率和召回率之间存在权衡,两者的平衡意味着我们应该在捕获少数类的同时尽量不漏掉多数类。因此,为了满足上述要求,计算两者的调和平均值作为综合指标,用F1表示。根据调和均值倾向于偏向数值较小的指标的特点,当准确率和召回率都较大时,F1的值越接近1,模型的分类效果越好。 F1的具体公式如下:
In addition, according to the calculation formulas of recall rate and specificity, recall rate can be used to measure the classification accuracy of the minority class, while specificity can represent the classification accuracy of most classes. Similarly, in order to take both recall rate and specificity into account, the geometric mean of both are constructed as a comprehensive evaluation index G, that is, only when both recall rate and specificity are high, the corresponding G value will be relatively ideal.
另外,根据召回率和特异性的计算公式,召回率可以用来衡量少数类的分类准确率,而特异性可以代表大多数类的分类准确率。同样,为了兼顾召回率和特异性,构造两者的几何平均值作为综合评价指标G,即只有当召回率和特异性都较高时,对应的G值才会比较理想。
To sum up, F1 and G, the two comprehensive evaluation indexes, can be used to measure the prediction ability of the model for samples of the minority class and the comprehensive prediction ability for two classes of samples, respectively. The larger the F1 is, the better the prediction ability of the model is in predicting the minority class samples, and vice versa. If G is large, it indicates that the model has high accuracy in predicting both classes of samples. Therefore, this paper measures the effect of the classification model of unbalanced samples by using two comprehensive evaluation indexes, F1 and G, which are calculated from the confusion matrix.
综上所述,F1和G这两个综合评价指标可以分别衡量模型对少数类样本的预测能力和对两类样本的综合预测能力。 F1越大,说明模型对少数类样本的预测能力越好,反之亦然。如果G很大,说明模型对两类样本的预测精度都很高。因此,本文利用混淆矩阵计算得到的F1和G两个综合评价指标来衡量不平衡样本分类模型的效果。
Selection of Risk Prediction Methods and Comparison of Prediction Results
风险预测方法的选择及预测结果的比较
Based on the sample data set constructed by the feature indicator variables and the label indicator variables constructed above, and considering the advantages of the support vector machine (SVM) model in dealing with such problems, this paper firstly uses the SVM model to forecast the risks of China’s crude oil futures market. The empirical process is completed in Python, mainly using Numpy, Pandas, Sklearn and other libraries. At the same time, in order to make the experimental prediction results more accurate, this paper also uses the five-fold cross validation method, and adopts the StratifiedKFold sampling method when dividing the training set and the test set to ensure that the proportion of normal samples and risk samples in the training set and the test set is consistent with the original data set. In the empirical study, the function SVC in Sklearn library, which is used to classify support vectors, is used to process the sample data in this paper. Considering the imbalance of samples in this paper, the class_weight parameter in the SVC function is set to balanced to make the results of the model more accurate.
基于上述构建的特征指标变量和标签指标变量构建的样本数据集,并考虑到支持向量机(SVM)模型在处理此类问题时的优势,本文首先使用SVM模型来预测风险中国原油期货市场。实证过程是用Python完成的,主要使用Numpy、Pandas、Sklearn等库。同时,为了使实验预测结果更加准确,本文还采用了五折交叉验证方法,在划分训练集和测试集时采用StratifiedKFold采样方法,保证正常的比例训练集和测试集中的样本和风险样本与原始数据集一致。在实证研究中,本文使用Sklearn库中用于支持向量分类的函数SVC来处理样本数据。本文考虑到样本的不平衡性,将SVC函数中的class_weight参数设置为balanced,以使模型的结果更加准确。
After empirical adjustment, the values of F1 and G are 0.1356 and 0.1387, respectively, both of which are relatively small, indicating that the prediction ability of the model is poor. Although the class_weight parameter has been processed, the decision hyperplane of SVM will still automatically bias to the minority class when processing asymmetric data sets, which will result in weak prediction ability of the model and failure to accurately identify the risk samples in this paper. Therefore, twin support vector machine (TWSVM) is introduced in this paper on the basis of SVM. One decision hyperplane in SVM is extended into two decision hyperplanes, making each hyperplane close to the sample points of this class and far away from the sample points of the other class, so as to overcome the defect of SVM when dealing with the problem of sample imbalance.
经过经验调整后,F1和G的值分别为0.1356和0.1387,均较小,表明模型的预测能力较差。尽管对class_weight参数进行了处理,但SVM的决策超平面在处理非对称数据集时仍然会自动偏向少数类,这将导致模型的预测能力较弱,无法准确识别本文的风险样本。因此,本文在SVM的基础上引入孪生支持向量机(TWSVM)。将SVM中的一个决策超平面扩展为两个决策超平面,使每个超平面靠近本类样本点,远离另一类样本点,从而克服SVM处理样本问题时的缺陷不平衡。
The Twin Support Vector Machine (TWSVM) method was first proposed by Khemchandani and Chandra (2007) Its basic idea is similar to the traditional SVM algorithm. It transforms a large classification problem into two small classification problems, so that the constraints of each quadratic programming problem become half of the original. Specifically, two non-parallel decision hyperplanes are determined by solving two related SVM classification problems, and samples are classified according to the closest decision hyperplane of a given sample point. This improvement not only solves the error caused by the sample imbalance to some extent, but also improves the generalization ability and iteration speed of the model.
双支持向量机(TWSVM)方法最早由 Khemchandani 和 Chandra(2007)提出,其基本思想与传统的 SVM 算法类似。它将一个大的分类问题转化为两个小的分类问题,使得每个二次规划问题的约束变成原来的一半。具体来说,通过求解两个相关的SVM分类问题确定两个不平行的决策超平面,根据给定样本点最接近的决策超平面对样本进行分类。这一改进不仅在一定程度上解决了样本不平衡带来的误差,而且提高了模型的泛化能力和迭代速度。
In order to make the prediction results of the two models comparable, the same training set and test set are also adopted in TWSVM, and the prediction results of SVM and TWSVM are compared, as shown in Table 5:
为了使两个模型的预测结果具有可比性,TWSVM中也采用相同的训练集和测试集,对SVM和TWSVM的预测结果进行比较,如表5所示:
TABLE 5. Comparison of prediction results of SVM and TWSVM.
表 5. SVM 和 TWSVM 的预测结果比较。
It can be found from the results in Table 5 that the F1 and G values of the TWSVM in the test set are significantly higher than those of traditional SVM model, that is, the prediction ability of the TWSVM model for samples of the minority class as well as the comprehensive class are better than that of SVM, indicating that TWSVM can effectively solve the problem of sample imbalance to some extent, and has high prediction accuracy.
从表5的结果可以发现,TWSVM在测试集中的F1和G值均显着高于传统SVM模型,即TWSVM模型对少数类样本的预测能力为综合类别均优于SVM,说明TWSVM能够在一定程度上有效解决样本不平衡问题,且具有较高的预测精度。
Risk Prediction Algorithm Selection and Prediction Results Comparison
风险预测算法选择及预测结果比较
For the problem of sample imbalance, most existing studies start from the data set level and solve the sample imbalance by over-sampling and under-sampling. However, over-sampling will lead to the problem of over-fitting, and under-sampling will lose important information in the data, so they are not advisable. At the algorithm level, in addition to changing the decision-making ideas of the algorithm (such as the TWSVM method mentioned above), we can start from the loss function of the algorithm. Lin et al. (2017) introduced the Focal loss function and weighted loss functions on the basis of XGBoost, an extreme gradient lifting algorithm proposed by Chen Tianqi, and proposed an algorithm of Imbalance- XGBOOST for unbalanced samples. On this basis, Wang et al. (2020) derived the theory in detail, and verified that the method could effectively solve the problem of sample imbalance through practical application, and expanded the use scenarios of XGBoost. For the convenience of understanding, two loss functions used in the improved algorithm are listed. It should be noted that since this paper is aimed at classification problems, the activation functions are all sigmoid functions.
针对样本不平衡问题,现有研究大多从数据集层面出发,通过过采样和欠采样的方式解决样本不平衡问题。但过采样会导致过拟合的问题,欠采样会丢失数据中的重要信息,因此并不可取。在算法层面,除了改变算法的决策思路(比如上面提到的TWSVM方法)之外,我们还可以从算法的损失函数入手。林等人。 (2017)在陈天奇提出的极限梯度提升算法XGBoost的基础上引入了Focal损失函数和加权损失函数,提出了针对不平衡样本的Imbalance-XGBOOST算法。在此基础上,王等人。 (2020)详细推导了理论,并通过实际应用验证了该方法能够有效解决样本不平衡问题,拓展了XGBoost的使用场景。为了方便理解,列出了改进算法中使用的两个损失函数。需要注意的是,由于本文针对的是分类问题,因此激活函数均为sigmoid函数。
For the focal loss function:
对于焦点损失函数:
For the weighted loss function:
对于加权损失函数:
Where
其中 是实际标签; 、 是参数。
In the empirical study of this section, this paper mainly calls the integrated libraries such as Sklearn and Imbalance-XGboost in Python to predict the risks of China’s crude oil futures market. Similarly, the samples used in this section are the same as those in the previous section, and the training set and the test set are also the same. When adjusting the parameters of the model, GridSearch is used to optimize the parameters of the above loss function within the range of (Altman, 1967; Li et al., 2019), and the optimal parameters (
在本节的实证研究中,本文主要调用Python中的Sklearn、Imbalance-XGboost等集成库来预测中国原油期货市场的风险。同样,本节使用的样本与上一节相同,训练集和测试集也相同。在调整模型参数时,使用GridSearch在(Altman, 1967; Li et al., 2019)范围内优化上述损失函数的参数,得到最优参数( )通过 best_estimator_ 接口返回。进一步,我们比较了XGBoost及其改进模型在最佳参数下的F1和G值,结果如表6所示。
TABLE 6. Comparison of prediction results of XGBoost series models.
表 6. XGBoost 系列模型的预测结果比较。
According to the empirical results, both F1 and G values of the original XGBoost are low, indicating that the non-equilibrium samples have a great impact on the prediction effect of the XGBoost algorithm. After the improvement of its loss function, the values of F1 and G are significantly improved, and when the focal loss function is used, the F1 and G of Focal-XGBoost are the best, indicating that Focal-XGBoost could effectively solve the problem of sample imbalance existing in this paper and improve the prediction accuracy of the model.
根据实证结果,原始XGBoost的F1和G值均较低,说明非平衡样本对XGBoost算法的预测效果影响较大。其损失函数改进后,F1和G的值都有明显改善,并且当使用焦点损失函数时,Focal-XGBoost的F1和G是最好的,表明Focal-XGBoost可以有效解决解决了本文存在的样本不平衡问题,提高了模型的预测精度。
Conclusion 结论
This paper takes the return rate series of China’s crude oil futures market as the research object, and uses the EMD-MFDFA method to study the multifractal characteristics based on 5-min high-frequency trading data. At the same time, the multifractal analysis is carried out on 111 trading data generated in each trading day, and the calculated daily multifractal spectral parameters are used to analyze the risk status of each trading day. The unsupervised clustering algorithms K-means and Gaussian Mixture Model (GMM) are further used to cluster the obtained spectral parameters. Each trading day is identified as the risk status or the normal status, and the identified risk status is used as the label data and combined with the corresponding technical indicators. SVM, XGBoost and their improved algorithms are used to predict the risks of China’s crude oil futures market, Based on the calculation results of confusion matrix, the prediction effects of each model are compared, and the optimal model is selected to predict the risks of China’s crude oil futures market, so that relevant investors can identify potential risks in advance and formulate prevention and control measures in time. The following conclusions are drawn:
本文以我国原油期货市场收益率序列为研究对象,采用EMD-MFDFA方法研究基于5 min高频交易数据的多重分形特征。同时,对每个交易日产生的111条交易数据进行多重分形分析,利用计算出的每日多重分形谱参数分析每个交易日的风险状况。进一步使用无监督聚类算法K-means和高斯混合模型(GMM)对获得的光谱参数进行聚类。将每个交易日识别为风险状态或正常状态,并将识别出的风险状态作为标签数据并与相应的技术指标相结合。采用SVM、XGBoost及其改进算法对我国原油期货市场风险进行预测,根据混淆矩阵的计算结果,比较各模型的预测效果,选择最优模型对我国原油期货市场风险进行预测。原油期货市场,让相关投资者提前识别潜在风险,及时制定防控措施。得出以下结论:
① There are obvious multifractal characteristics in the return rate series of both China’s crude oil futures market and its single trading day, and the calculated daily multifractal parameters can effectively show the fluctuation of the series.
①我国原油期货市场及单交易日收益率序列均存在明显的多重分形特征,计算出的日多重分形参数能够有效反映该序列的波动情况。
② Due to the imbalance of sample data, twin support vector machine (TWSVM) model has better prediction ability than the traditional support vector machine (SVM) model for the risk prediction of China’s crude oil futures market.
②由于样本数据不平衡,孪生支持向量机(TWSVM)模型对我国原油期货市场风险预测比传统支持向量机(SVM)模型具有更好的预测能力。
③ The XGBoost algorithm has a great impact on the risk prediction, and the Focal-XGBoost is better for China’s crude oil market risk prediction.
③ XGBoost算法对风险预测影响较大,其中Focal-XGBoost对中国原油市场风险预测效果较好。
Data Availability Statement
数据可用性声明
The raw data supporting the conclusion of this article will be made available by the authors, without undue reservation.
支持本文结论的原始数据将由作者毫无保留地提供。
Author Contributions 作者贡献
Conceptualization, YG, SZ, and YL; Data curation, SZ and YL; Formal analysis, YG, SZ, and YL; Methodology, YG, SZ, and YL; Software, SZ; Validation, YG, SZ, and YL; Writing–original draft, YG, SZ, and YL; Writing–review and editing, YG, SZ, and YL.
概念化、YG、SZ 和 YL;数据管理,SZ 和 YL;形式分析,YG、SZ 和 YL;方法论、YG、SZ 和 YL;软件,深圳;验证、YG、SZ 和 YL;写作——原稿、YG、SZ、YL;写作评论和编辑,YG、SZ 和 YL。
Funding 资金
This research was funded by Natural Science Foundation of Hunan Province of China (2021JJ30175).
该研究得到湖南省自然科学基金项目(2021JJ30175)的资助。
Conflict of Interest 利益冲突
The authors declare that the research was conducted in the absence of any commercial or financial relationships that could be construed as a potential conflict of interest.
作者声明,该研究是在不存在任何可能被视为潜在利益冲突的商业或财务关系的情况下进行的。
Publisher’s Note 出版商备注
All claims expressed in this article are solely those of the authors and do not necessarily represent those of their affiliated organizations, or those of the publisher, the editors and the reviewers. Any product that may be evaluated in this article, or claim that may be made by its manufacturer, is not guaranteed or endorsed by the publisher.
本文中表达的所有主张仅代表作者的主张,并不一定代表其附属组织或出版商、编辑和审稿人的主张。本文中可能评估的任何产品或其制造商可能提出的声明均未得到出版商的保证或认可。
References 参考
Altman, E. I. (1967). The Prediction of Corporate Bankruptcy: A Discriminant Analysis. Los Angeles: University of California.
奥尔特曼,E.I. (1967)。公司破产的预测:判别分析。洛杉矶:加利福尼亚大学。
Dong, H., Liu, Y., Liu, Y., and Chang, J. (2019). The Heterogeneous Linkage of Economic Policy Uncertainty and Oil Return Risks. Green Financ.
董 H.、刘 Y.、刘 Y. 和张 J. (2019)。经济政策不确定性与石油回流风险的异质联系。绿色金融。 1、46-66。 doi:10.3934/gf.2019.1.46
Feng, Y. S., and Cao, B. M. (2022). Multifractal Fluctuation Analysis of Correlations between Agricultural Futures Markets in China and the US Based on MF-X-DFA and MF-DPXA Methods[J]. Fluctuation Noise Lett. 21 (01). doi:10.1142/s0219477522500067![]()
Ji, Q., and Zhang, D. (2019). China's Crude Oil Futures: Introduction and Some Stylized Facts. Finance Res. Lett. 28, 376–380. doi:10.1016/j.frl.2018.06.005![]()
Jiang, Z. Q., and Zhou, W. X. (2011). Multifractal Detrending Moving-Average Cross-Correlation Analysis. Phys. Rev. E Stat. Nonlin Soft Matter Phys. 84, 016106. doi:10.1103/PhysRevE.84.016106![]()
Kantelhardt, Jan W., Zschiegner, Stephan A., Koscielny-Bunde, Eva, Havlin, Shlomo, Bunde, Armin, and Eugene Stanley, H. (2002). Multifractal Detrended Fluctuation Analysis of Nonstationary Time Series. Phys. A Stat. Mech. its Appl. 316 (1). doi:10.1016/s0378-4371(02)01383-3![]()
Khemchandani, R., and Chandra, S. (2007). Twin Support Vector Machines for Pattern Classification. IEEE Trans. Pattern Anal. Mach. Intell.
Latunde, T., Akinola, L. S., Shina Akinola, L., and Deborah Dare, D. (2020). Analysis of Capital Asset Pricing Model on Deutsche Bank Energy Commodity. Green Financ.
Li, J. M., Wei, H. J., Wei, L. D., Zhou, D. P., and Qiu, Y. (2020). Extraction of Frictional Vibration Features with Multifractal Detrended Fluctuation Analysis and Friction State Recognition. Symmetry-Basel
Li, Q., and Xie, W. (2013). Classification of Aircraft Targets with Low-Resolution Radars Based on Multifractal Spectrum Features. J. Electromagn. Waves Appl.
Li, S., and Quan, Y. (2019). Financial Risk Prediction for Listed Companies Using IPSO-BP Neural Network. Int. J. Perform. Eng. 15 (4), 1209. doi:10.23940/ijpe.19.04.p16.12091219![]()
Li, X., Shang, W., and Wang, S. (2019). Text-based Crude Oil Price Forecasting: A Deep Learning Approach. Int. J. Forecast.
Li, Z. H., Dong, H., Floros, C., Charemis, A., and Failler, P. (2021). Re-examining Bitcoin Volatility: A CAViaR-Based Approach. Emerg. Mark. Financ. Trade, 1–19. doi:10.1080/1540496x.2021.1873127![]()
Li, Z., Wang, Y., and Huang, Z. (2020). Risk Connectedness Heterogeneity in the Cryptocurrency Markets. Front. Phys.
Lin, T. Y., Goyal, P., Girshick, R., He, K., and Dollár, P. (2017). “Focal Loss for Dense Object Detection,” in Proceedings of the IEEE International Conference on Computer Vision, 2980–2988.
Liu, K., Luo, C., Luo, C., and Li, Z. (2019). Investigating the Risk Spillover from Crude Oil Market to BRICS Stock Markets Based on Copula-POT-CoVaR Models. Quantitative Finance Econ. 3 (4), 754–771. doi:10.3934/qfe.2019.4.754![]()
Liu, K., Luo, C. Q., Luo, C., and Li, Z. (2019). Investigating the Risk Spillover from Crude Oil Market to BRICS Stock Markets Based on Copula-POT-CoVaR Models. Quant. Financ. Econ.
Lo, W. C . (1989). Long-term Memory in Stock Market Prices. Work. Pap. doi:10.3386/w2984![]()
Ma, X., and Lv, S. (2019). Financial Credit Risk Prediction in Internet Finance Driven by Machine Learning. Neural Comput. Applic 31 (12), 8359–8367. doi:10.1007/s00521-018-3963-6![]()
Mandelbrot, B. B., and Wheeler, J. A. (1983). The Fractal Geometry of Nature. Am. J. Phys.
Özdurak, C. (2021). Nexus between Crude Oil Prices, Clean Energy Investments, Technology Companies and Energy Democracy. Gf 3 (3), 337–350. doi:10.3934/gf.2021017![]()
Peng, C. K., Buldyrev, S. V., Havlin, S., Simons, M., Stanley, H. E., and Goldberger, A. L. (1994). Mosaic Organization of DNA Nucleotides. Phys. Rev. E Stat. Phys. Plasmas Fluids Relat. Interdiscip. Top. 49 (2), 1685–1689. doi:10.1103/physreve.49.1685![]()
Peters, E. E . (1994). Fractal Market Analysis : Applying Chaos Theory to Investment and Economics. John Wiley & Sons. Vol. 24.
Peters, E. E. (1996). Chaos and Order in the Capital Markets: A New View of Cycles, Prices,and Market Volatility. John Wiley & Sons.
Peters, E. E. (1994). Fractal Market Analysis: Applying Chaos Theory to Investment and Economics. John Wiley & Sons.
Podobnik, B., Horvatic, D., Petersen, A. M., and Stanley, H. E. (2009). Cross-correlations between Volume Change and Price Change. Proc. Natl. Acad. Sci. U. S. A.
Podobnik, B., and Stanley, H. E. (2008). Detrended Cross-Correlation Analysis: a New Method for Analyzing Two Nonstationary Time Series. Phys. Rev. Lett.
Ruan, Q., Jiang, W., and Ma, G. (2016). Cross-correlations between Price and Volume in Chinese Gold Markets. Phys. A Stat. Mech. its Appl., 451. doi:10.1016/j.physa.2015.12.164![]()
Sun, H. G., and Li, W. H. (2018). “Analysis of the Fluctuation of Chinese Crude Oil Futures- Based on GARCH-type Model,” in Proceedings of the 2018 3rd International Conference on Modelling, Simulation and Applied Mathematics. Editors A. LuevanosRojas, G. Ilewicz, D. J. Jakobczak, and K. Weller (Paris: Atlantis Press), 160, 110–112. doi:10.2991/msam-18.2018.25![]()
Sun, X., Chen, H. P., Wu, Z. Q., and Yuan, Y. Z. (2001). Multifractal Analysis of Hang Seng Index in Hong Kong Stock Market. Phys. A 291 (1-4), 553–562. doi:10.1016/s0378-4371(00)00606-3![]()
Tam, K. (1991). Neural Network Models and the Prediction of Bank Bankruptcy. Omega
Tam, K. Y., and Kiang, M. (1990). Predicting Bank Failures: A Neural Network Approach. Appl. Artif. Intell.
Uthayakumar, J., Metawa, N., Shankar, K., and Lakshmanaprabu, S. K. (2020). Intelligent Hybrid Model for Financial Crisis Prediction Using Machine Learning Techniques. Inf. Syst. E-Bus Manage 18 (4), 617–645. doi:10.1007/s10257-018-0388-9![]()
Wang, C., Deng, C., and Wang, S. (2020). Imbalance-XGBoost: Leveraging Weighted and Focal Losses for Binary Label-Imbalanced Classification with XGBoost. Pattern Recognit. Lett.
Wang, J., Shang, P., and Weijie, G. E. (2012). Multifractal Cross-Correlation Analysis Based on Statistical Moments. Fractals
Wang, Y., Wei, Y., and Wu, C. (2011). Detrended Fluctuation Analysis on Spot and Futures Markets of West Texas Intermediate Crude Oil. Phys. A Stat. Mech. its Appl. 390 (5), 864–875. doi:10.1016/j.physa.2010.11.017![]()
Wei, Y., and Huang, D. S. (2005). Multifractal Analysis of SSEC in Chinese Stock Market: A Different Empirical Result from Heng Seng Index. Phys. A 355 (2-4), 497–508. doi:10.1016/j.physa.2005.03.027![]()
Weng, F., Zhang, H., and Yang, C. (2021). Volatility Forecasting of Crude Oil Futures Based on a Genetic Algorithm Regularization Online Extreme Learning Machine with a Forgetting Factor: The Role of News during the COVID-19 Pandemic. Resour. Policy
Yuan, Y., Zhuang, X.-t., and Jin, X. (2009). Measuring Multifractality of Stock Price Fluctuation Using Multifractal Detrended Fluctuation Analysis. Phys. A Stat. Mech. its Appl. 388 (11), 2189–2197. doi:10.1016/j.physa.2009.02.026![]()
Zhang, X., Yang, L., and Zhu, Y. (2019). Analysis of Multifractal Characterization of Bitcoin Market Based on Multifractal Detrended Fluctuation Analysis. Phys. A Stat. Mech. its Appl., 523. doi:10.1016/j.physa.2019.04.149![]()
Zhao, D. D., Ding, J. C., and Chai, S. C. (2018). Systemic Financial Risk Prediction Using Least Squares Support Vector Machines. Mod. Phys. Lett. B
Zhu, H., and Zhang, W. (2018). Multifractal Property of Chinese Stock Market in the CSI 800 Index Based on MF-DFA Approach. Phys. A Stat. Mech. its Appl. 490, 497–503. doi:10.1016/j.physa.2017.08.060![]()
Keywords: China’s crude oil futures, multifractal, clustering, sample imbalance, risk prediction
Citation: Guo Y, Zhang S and Liu Y (2022) Research on Risk Features and Prediction of China’s Crude Oil Futures Market Based on Machine Learning. Front. Energy Res. 10:741018. doi: 10.3389/fenrg.2022.741018![]()
Received: 14 July 2021; Accepted: 08 June 2022;
Published: 07 July 2022.
Edited by:
Xun Zhang, Academy of Mathematics and Systems Science (CAS), ChinaReviewed by:
Vidya C. T., Centre for Economic and Social Studies (CESS), IndiaNarottam Das, Central Queensland University, Australia
Wendong Yang, Shandong University of Finance and Economics, China
Copyright © 2022 Guo, Zhang and Liu. This is an open-access article distributed under the terms of the Creative Commons Attribution License (CC BY). The use, distribution or reproduction in other forums is permitted, provided the original author(s) and the copyright owner(s) are credited and that the original publication in this journal is cited, in accordance with accepted academic practice. No use, distribution or reproduction is permitted which does not comply with these terms.
*Correspondence: Yanqiong Liu, sxyliuyq@hnfnu.edu.cn
Disclaimer: All claims expressed in this article are solely those of the authors and do not necessarily represent those of their affiliated organizations, or those of the publisher, the editors and the reviewers. Any product that may be evaluated in this article or claim that may be made by its manufacturer is not guaranteed or endorsed by the publisher.