Abstract 抽象
Cancer cachexia is commonly seen in patients with malignant tumors, which usually leads to poor life quality and negatively affects long-term prognosis and survival. Mitochondria dysfunction and enhanced autophagy are well-established to play an important role in skeletal muscle wasting. However, whether mitophagy is engaged in the pathogenesis of cancer cachexia requires further investigation. This study comprised a clinical study and animal experimentation. Clinical data such as CT images and laboratory results were obtained and analyzed. Then mice model of cancer cachexia and mitophagy inhibition were established. Data including skeletal muscle mass and function, mitochondria structure and function, inflammatory factors as well as ROS concentration. Mitophagy was enhanced in cancer cachexia patients with increased inflammatory factors. Greater disruption of skeletal muscle fiber and mitochondria structure were seen in cancer cachexia, with a higher level of inflammatory factors and ROS expression in skeletal muscle. Meanwhile, ATP production was undermined, indicating a close relationship with mitophagy, inflammation, and oxidative stress in the skeletal muscle of cancer cachexia mice models. In conclusion, mitophagy is activated in cancer cachexia and may play a role in skeletal muscle atrophy, and inflammation and oxidative stress might participate in mitophagy-related skeletal muscle injury.
癌症恶病质常见于恶性肿瘤患者,通常导致生活质量差,对远期预后和生存产生负面影响。线粒体功能障碍和增强的自噬在骨骼肌萎缩中起着重要作用。然而,线粒体自噬是否参与癌症恶病质的发病机制需要进一步研究。这项研究包括临床研究和动物实验。获取并分析 CT 图像和实验室结果等临床数据。然后建立癌症恶病质和线粒体自噬抑制小鼠模型。数据包括骨骼肌质量和功能、线粒体结构和功能、炎症因子以及 ROS 浓度。在炎症因子增加的癌症恶病质患者中,线粒体自噬增强。在癌症恶病质中观察到骨骼肌纤维和线粒体结构的更大破坏,骨骼肌中炎症因子和 ROS 表达水平更高。同时,ATP 的产生被破坏,表明与癌症恶病质小鼠模型中骨骼肌中的线粒体自噬、炎症和氧化应激密切相关。总之,线粒体自噬在癌症恶病质中被激活,可能在骨骼肌萎缩中发挥作用,炎症和氧化应激可能参与线粒体自噬相关的骨骼肌损伤。
Keywords: cancer cachexia, mitophagy, skeletal muscle wasting, inflammation, oxidative stress
关键词:癌症恶病质, 线粒体自噬, 骨骼肌萎缩, 炎症, 氧化应激
Introduction 介绍
Cancer cachexia is a syndrome caused by multiple factors, characterized by different degrees of skeletal muscle wasting and dysfunction,(1) causing impairment during daily activities, motor function degeneration and a negative effect on the quality of life, worsening long-term prognosis.(2,3) Therefore, the mechanism and the treatment of skeletal muscle loss in cancer cachexia warrant further research.
癌症恶病质是一种由多种因素引起的综合征,其特征是骨骼肌不同程度的萎缩和功能障碍,(1) 导致日常活动受损、运动功能退化和对生活质量的负面影响,使长期预后恶化。(2,3)因此,癌症恶病质中骨骼肌损失的机制和治疗值得进一步研究。
An increasing body of evidence suggests that autophagic-lysosomal system (ALS) overactivation is responsible for skeletal muscle protein degradation in cancer cachexia patients.(4,5) Autophagy is a cleansing process in different varieties of cells; damaged or aging proteins and organelles automatically form into autophagosomes and are subject to degeneration by lysosomes to maintain an overall metabolic balance.(6,7) However, in wasting diseases like cancer cachexia, unduly ALS activation causes body composition wasting, negative energy balance and skeletal muscle loss.(8) As a special form of autophagy, mitophagy is characterized by the removal of mitochondria.(9) Previous studies have revealed that mitophagy is accomplished through different pathways, Parkin-dependent and non-Parkin protein-dependent pathways such as Bcl2 and adenovirus E1B19 kDa interacting protein 3 (BNIP3) and FUN14 domain containing 1 (FUNDC1) protein pathways documented in different diseases.(10–12)
越来越多的证据表明,自噬溶酶体系统 (ALS) 过度激活是导致癌症恶病质患者骨骼肌蛋白降解的原因。(4,5)自噬是不同种类细胞中的清洁过程;受损或老化的蛋白质和细胞器会自动形成自噬体,并被溶酶体变性以维持整体代谢平衡。(6,7)然而,在癌症恶病质等消耗性疾病中,ALS 的过度激活会导致身体成分消耗、负能量平衡和骨骼肌流失。(8) 作为自噬的一种特殊形式,线粒体自噬的特征是去除线粒体。(9) 以前的研究表明,线粒体自噬是通过不同的途径完成的,Parkin 依赖性和非 Parkin 蛋白依赖性途径,例如 Bcl2 和腺病毒 E1B19 kDa 相互作用蛋白 3 (BNIP3) 和 FUN14 结构域包含 1 (FUNDC1) 蛋白质途径在不同疾病中记录。(10-12)
As the major factory of energy production, the overall wellness of mitochondria is critical for physical maintenance. Mitochondrial fission and fusion simultaneously exist in different cells, and a dynamic mitochondrial metabolism is balanced with mitophagy.(13,14) It has been established that the dynamic balance between mitochondrial generation and degradation is critical for quality maintenance, and dynamic dysfunction might be closely related to skeletal muscle loss in cancer cachexia.(15,16) Although the relationship between mitophagy and cancer cachexia is not clear, recent studies revealed that mitophagy is promoted in diseases such as sepsis and renal diseases.(17,18) Enhanced inflammation and oxidative stress have been related to dysregulated mitophagy, which leads to organ dysfunction and systemic damage.(19,20)
作为能源生产的主要工厂,线粒体的整体健康对于物理维护至关重要。线粒体裂变和融合同时存在于不同的细胞中,动态线粒体代谢与线粒体自噬相平衡。(13,14)已经确定线粒体生成和降解之间的动态平衡对于质量维持至关重要,动态功能障碍可能与癌症恶病质中的骨骼肌损失密切相关。(15,16)虽然线粒体自噬与癌症恶病质之间的关系尚不清楚,但最近的研究表明,线粒体自噬在败血症和肾脏疾病等疾病中得到促进。(17,18)炎症和氧化应激增强与线粒体自噬失调有关,线粒体自噬失调导致器官功能障碍和全身损伤。(19,20)
Therefore, the current study aims at exploring mitophagy activity in the skeletal muscle of cancer cachexia subjects and whether inflammation and oxidative stress are related to dysregulated mitophagy, hoping to identify a new target for the treatment of this particular patient population.
因此,本研究旨在探讨癌症恶病质受试者骨骼肌中的线粒体自噬活性,以及炎症和氧化应激是否与线粒体自噬失调有关,希望确定治疗这一特定患者群体的新靶点。
Methods 方法
Patients 病人
This study was approved by the Ethics committee of Zhongshan Hospital, Fudan University. Thirty one patients with gastrointestinal cancer indicated for surgery from June 2021 to June 2022 were prospectively recruited. The inclusion criteria were as follows: (1) aged from 18 to 90 years old; (2) diagnosed with gastrointestinal cancer; (3) patients with surgical indications; (4) written consent was provided. The exclusion criteria included: (1) patients that underwent emergency surgery; (2) patients with severe comorbidities such as heart failure and sepsis; (3) weight loss unrelated to cancer; (4) contraindicated for surgery. General characteristic includes disease type, age, height, body weight, body mass index (BMI), weight loss in recent 6 months, NRS-2002 score and comorbidities. Examination information included: albumin, inflammatory factors, computed tomography (CT) scan images, and clinicopathological features.
本研究得到复旦大学附属中山医院伦理委员会的批准。前瞻性招募了 2021 年 6 月至 2022 年 6 月期间需要手术的 31 名胃肠道癌患者。纳入标准如下: (1) 年龄在 18 至 90 岁之间;(2) 被诊断患有胃肠道癌;(3) 有手术指征的患者;(4) 提供书面同意。排除标准包括: (1) 接受紧急手术的患者;(2) 患有心力衰竭和脓毒症等严重合并症的患者;(3) 与癌症无关的体重减轻;(4) 手术禁忌。一般特征包括疾病类型、年龄、身高、体重、体重指数 (BMI)、近 6 个月体重减轻、NRS-2002 评分和合并症。检查信息包括:白蛋白、炎症因子、计算机断层扫描 (CT) 扫描图像和临床病理特征。
After being recruited, patients were divided into a control group and a cancer cachexia group. The cachexia diagnostic criteria were as follows: (1) >5% weight loss over the past 6 months; (2) BMI <20 kg/m2 and >2% weight loss over the past 6 months; (3) Absence of sarcopenia and >2% weight loss over the past 6 months. Rectus abdominis muscle specimens were acquired during surgery. A 1 cm3 muscle specimen was obtained from each patient using sharp dissection and stored at −80°C until further use.
招募后,将患者分为对照组和癌症恶病质组。恶病质诊断标准如下: (1) 过去 6 个月体重减轻 >5%;(2) 过去 6 个月 BMI <20 kg/m2 和 >2% 体重减轻;(3) 过去 6 个月内无肌肉减少症和 >2% 体重减轻。腹直肌标本是在手术期间获得的。使用锐利解剖从每位患者身上获得 1 cm3 的肌肉标本,并储存在 -80°C 直至进一步使用。
Animal models 动物模型
Balb/c mice were obtained from the central laboratory and divided into 4 groups: a control group (C, n = 5), mitophagy inhibited group (M, n = 5), cancer cachexia group (CC, n = 5), and cancer cachexia with mitophagy inhibited group (CCM, n = 5). Mice in the control group did not receive any treatment. Mice in the mitophagy-inhibited group were injected with mitochondrial division inhibitor 1 (mdivi-1) while the cancer cachexia group was inoculated with tumor cells. The cancer cachexia with mitophagy-inhibited group was inoculated with tumor cells and injected with mdivi-1. After a week of acclimation, C26 cells were injected subcutaneously on the first day of the experiment to establish the cancer cachexia model. Mdivi-1 was used daily through intraperitoneal injection since day 14 with 30 mg/kg body weight to inhibit mitophagy. During modeling, all groups were weighed every two days, and grip strength and autonomous activity were tested every week. All four groups were anesthetized on day 21 and sacrificed to harvest the gastrocnemius muscle. Part of the muscle specimen was divided and fixed in fixation liquid. The remaining tissues were stored at −80°C until further usage. This study was approved by the Ethics committee of Zhongshan Hospital, Fudan University.
从中心实验室获得 Balb/c 小鼠,分为 4 组:对照组 (C, n = 5)、线粒体自噬抑制组 (M, n = 5)、癌症恶病质组 (CC, n = 5) 和线粒体自噬抑制癌恶病质组 (CCM, n = 5)。对照组小鼠未接受任何治疗。线粒体自噬抑制组小鼠注射线粒体分裂抑制剂 1 (mdivi-1),而癌症恶病质组接种肿瘤细胞。线粒体自噬抑制癌病质组接种肿瘤细胞并注射 mdivi-1。驯化一周后,实验第一天皮下注射 C26 细胞,建立癌症恶病质模型。从第 14 天开始每天通过腹腔注射使用 Mdivi-1,体重为 30 mg/kg 体重以抑制线粒体自噬。在建模过程中,所有组每两天称重一次,每周测试握力和自主活动。所有四组均在第 21 天麻醉并处死以收获腓肠肌。将部分肌肉标本分开并固定在固定液中。将剩余的组织储存在 -80°C 下直至进一步使用。本研究得到复旦大学附属中山医院伦理委员会的批准。
CT image analysis CT 图像分析
CT scan was performed before surgery, and the images of the third lumbar vertebra layer were extracted. Skeletal muscle were selected through tissue-specific Hounsfield units (HU) thresholds from −29 to +150 HU, and the area of skeletal muscle was documented and normalized by height and represented as skeletal muscle index (SMI, cm2/m2).
术前行 CT 扫描,提取第三腰椎层图像。骨骼肌是通过组织特异性 Hounsfield 单位 (胡) 阈值从 -29 到 +150 胡 来选择的,骨骼肌的面积被记录并按身高标准化,并表示为骨骼肌指数 (SMI, cm2/m2)。
Skeletal muscle fiber area
骨骼肌纤维面积
After formalin fixation and paraffin embedding, the gastrocnemius muscle was cut into cross-sections and was observed under light microscopy after hematoxylin and eosin staining. Fiber areas in cross-sections of ≥150 fibers were measured using ImageJ software ver. 1.53t.
福尔马林固定和石蜡包埋后,将腓肠肌切成横截面,苏木精和伊红染色后在光学显微镜下观察。使用 ImageJ 软件 ver. 1.53t 测量 ≥150 纤维横截面中的纤维面积。
Ultrastructural analyses 超微结构分析
After glutaraldehyde-osmium fixation and upon embedding, the gastrocnemius muscle was longitudinally sectioned. Skeletal fiber arrangement, mitochondrial diameter and structure were assessed by a scanning Transmission Electron Microscope (HT7800; HITACHI, Tokyo, Japan).
戊二醛-锇固定后和嵌入后,对腓肠肌进行纵向切片。通过扫描透射电子显微镜 (HT7800;HITACHI, Tokyo, Japan)。
Western blot analysis 蛋白质印迹分析
Fifty mg skeletal muscle was divided and added into RIPA buffer, phosphatase inhibitors, and protease. Proteins were extracted and quantified to 5 μg/ml with BCA protein quantitation Kit, then were separated by 7.5% and 12.5% SDS-PAGE, electrophoretically transferred to a polyvinylidene difluoride membrane and blocked by BSA. After incubation overnight at 4°C with anti-LC3A/B, anti-Bnip3 (1:1,000, Cell Signaling Technology, Danvers, MA) and anti-PINK1 (1:1,000; Abcam, Cambridge, UK), membranes were washed by TBST and incubated with anti-mouse or anti-rabbit Ig. Immunoreactive bands were visualized by enhanced chemiluminescence solution (Thermo Scientific, Waltham, MA). Band quantitative analysis was performed using ImageJ software ver. 1.53t.
将 50 mg 骨骼肌分成 RIPA 缓冲液、磷酸酶抑制剂和蛋白酶中。提取蛋白质并用 BCA 蛋白定量试剂盒定量至 5 μg/ml,然后用 7.5% 和 12.5% SDS-PAGE 分离,电泳转印到聚偏二氟乙烯膜上并用 BSA 封闭。在 4°C 下与抗 LC3A/B、抗 Bnip3(1:1,000,Cell Signaling Technology,丹佛斯,马萨诸塞州)和抗 PINK1(1:1,000;Abcam,Cambridge,UK),用 TBST 洗涤膜并与抗小鼠或抗兔 Ig 孵育。通过增强的化学发光溶液 (Thermo Scientific, Waltham, MA) 观察免疫反应条带。使用 ImageJ 软件版本 1.53t 进行条带定量分析。
Inflammatory factors 炎症因子
Protein was extracted from gastrocnemius muscles, and analyzed by mouse IL-6 Elisa Kit (H007-1-2; Nanjing Jiancheng, Nanjing, China) and mouse TNF-α Elisa Kit (HH052-1; Nanjing Jiancheng), according to the manufacturer’s instructions, and the results were analyzed by GraphPad Prism 8 software.
从腓肠肌中提取蛋白质,并通过小鼠 IL-6 Elisa 试剂盒 (H007-1-2;南京建成,中国南京)和小鼠 TNF-α Elisa 试剂盒 (HH052-1;南京建成),根据制造商的说明,并通过 GraphPad Prism 8 软件对结果进行了分析。
ATP concentration ATP 浓度
Gastrocnemius muscles were lyzed with RIPA buffer and a mixture of phosphatase inhibitors and protease. The ATP assay kit (A095-1-1; Nanjing Jiancheng) was utilized, and through phosphorylation of glycerol, samples were quantified by colorimetric means (570 nm). ATP concentration analysis was conducted following the instructions of the ATP assay kit, and the results were analyzed by GraphPad Prism 8 software.
用 RIPA 缓冲液和磷酸酶抑制剂和蛋白酶的混合物裂解腓肠肌。ATP 检测试剂盒 (A095-1-1;利用南京建成),通过甘油磷酸化,用比色法 (570 nm) 定量样品。按照 ATP 检测试剂盒的说明进行 ATP 浓度分析,并通过 GraphPad Prism 8 软件分析结果。
Immunohistochemistry 免疫组化
Gastrocnemius muscles were formalin-fixed and paraffin-embedded. After endogenous peroxidase inactivation, heat-induced antigen retrieval and serum incubation, samples were incubated overnight at 4°C with primary antibodies Anti-Fbx32 and Anti-MuRF1 (1:400, Abcam) and incubated in goat anti-mouse IgG antibody. Then sections were incubated in an avidin-biotin complex at 37°C for 30 min and nuclear stained with hematoxylin. After treatment with diaminobenzene, sections were dehydrated with ethanol and treated with xylene. ImageJ software ver. 1.53t was used for data analysis.
腓肠肌是福尔马林固定和石蜡包埋的。内源性过氧化物酶灭活、热诱导抗原修复和血清孵育后,将样品与一抗抗 Fbx32 和抗 MuRF1(1:400,Abcam)在 4°C 下孵育过夜,并在山羊抗小鼠 IgG 抗体中孵育。然后将切片在 37°C 下在亲和素-生物素复合物中孵育 30 分钟,并用苏木精进行核染色。用二氨基苯处理后,切片用乙醇脱水并用二甲苯处理。ImageJ 软件版本 1.53t 用于数据分析。
Skeletal muscle specimens stored at −80°C were sliced by cryostat and stained with Dihydroethidium (DHE). After incubating at 37°C for 30 min, 4',6-diamidino-2-phenylindole (DAPI; G1012; Servicebio, Wuhan, China) was used for nuclear counterstaining and sections were mounted with Antifade Mounting Medium (G1401; Servicebio), observed with a Zeiss 780 laser scanning confocal microscope (Carl Zeiss Microscopy GmbH, Jena, Germany). Quantitative analysis was performed using ImageJ software ver. 1.53t.
用低温恒温器对储存在 −80°C 的骨骼肌标本进行切片,并用二氢乙锭 (DHE) 染色。在 37°C 下孵育 30 分钟后,4',6-二脒基-2-苯基吲哚 (DAPI;G1012;Servicebio,中国武汉)用于细胞核复染,切片用抗淬灭封固剂 (G1401;Servicebio),用蔡司 780 激光扫描共聚焦显微镜(Carl Zeiss Microscopy GmbH,德国耶拿)观察。使用 ImageJ 软件版本 1.53t 进行定量分析。
Statistical analysis 统计分析
Quantitative data from different groups were expressed as means ± SD (normally distributed) or median (nonnormally distributed) and were compared by one-way ANOVA and Bonferroni post hoc test. Categorical data were expressed as numbers and percentages, while the Chi-squared test or Fisher’s exact probability tests were used to compare differences between groups. A p value <0.05 was statistically significant. Statistical analyses were performed with GraphPad Prism 8 software (GraphPad Software, San Diego, CA) and SPSS Statistics ver. 23.0 (IBM, New York, NY).
来自不同组的定量数据表示为 SD (正态分布) 或中位数 (非正态分布) ±均值,并通过单因素方差分析和 Bonferroni 事后检验进行比较。分类数据表示为数字和百分比,而卡方检验或 Fisher 精确概率检验用于比较组间差异。p 值 <0.05 具有统计学意义。使用 GraphPad Prism 8 软件(GraphPad Software,San Diego,CA)和 SPSS Statistics ver. 23.0(IBM,New York,NY)进行统计分析。
Results 结果
Patients characteristics 患者特征
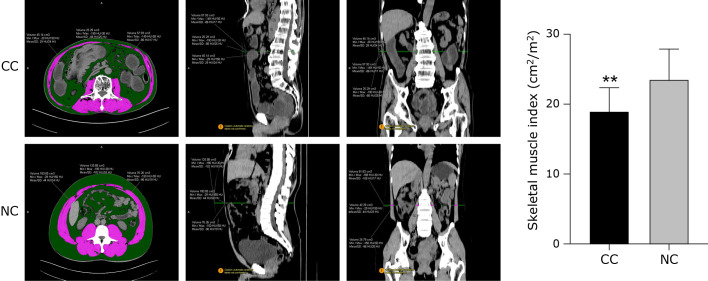
Thirty one patients with gastrointestinal cancer were enrolled and divided into cancer cachexia (n = 13) and control (n = 18) groups. The clinical characteristics are shown in Table 1. The skeletal muscle area in the cancer cachexia group exhibited a significant decline in CT imaging (Fig. 1A). The mean age of the patients was 64 years, and the SMI of the cancer cachexia group was significantly lower than the control group (Fig. 1B).
纳入 31 例胃肠道癌患者,分为癌症恶病质组 (n = 13) 和对照组 (n = 18)。临床特征见表 1。癌症恶病质组的骨骼肌区域在 CT 成像中表现出显着下降(图 1A)。患者的平均年龄为 64 岁,癌症恶病质组的 SMI 显著低于对照组(图 1B)。
Table 1. 表 1.
Clinical characteristics of patients with digestive tumor
消化道肿瘤患者的临床特征
| Characteristic 特征 | Overall patients 总体患者 (n = 31) (n = 31) |
Control 控制 (n = 18) (n = 18) |
Cancer cachexia 癌症恶病质 (n = 13) (n = 13) |
p value p 值 | |
|---|---|---|---|---|---|
| Sex 性 | Male 雄 | 19 (61.3) | 11 (61.1) | 8 (61.5) | 0.98 |
| Female 女性 | 12 (38.7) | 7 (38.9) | 5 (38.5) | ||
| Age (year) 年龄 (岁) | 63.8 ± 11.6 | 64.8 ± 8.9 | 0.8 | ||
| Comorbidity 合并症 | Yes 是的 | 14 (45.2) | 8 (44.4) | 6 (46.2) | 0.93 |
| No 不 | 17 (54.8) | 10 (55.6) | 7 (53.8) | ||
| Height (cm) 高度 (cm) | 165.0 ± 10.3 | 164.5 ± 7.5 | 0.88 | ||
| Weight (kg) 重量 (kg) | 66.3 ± 9.9 | 58.9 ± 7.5 | 0.03* | ||
| BMI (kg/m2) 体重指数 (kg/m2) | 24.3 ± 2.7 | 21.7 ± 2.2 | |||
| NRS-2002 score NRS-2002 分数 | <3 | 13 (41.9) | 13 (72.2) | 0 (0) | <0.01* |
| ≥3 | 18 (58.1) | 5 (27.8) | 13 (100) | ||
| Albumin (g/L) 白蛋白 (g/L) | 41.0 ± 3.0 | 38.4 ± 3.6 | 0.02* | ||
| SMI (cm2/m2) SMI (厘米2/米2) |
46.9 ± 8.8 | 37.9 ± 7.0 | 0.01 | ||
| Histological types 组织学类型 | Poor differentiated 差异化差 | 4 (12.9) | 3 (16.7) | 1 (76.9) | 0.84 |
| Poor-medium differentiated 差-中等差异化 |
13 (41.9) | 7 (38.9) | 6 (46.1) | 0.69 | |
| Medium differentiated 中等差异化 | 13 (41.9) | 7 (38.9) | 6 (46.1) | 0.69 | |
| High differentiated 高差异化 | 1 (3.2) | 1 (5.5) | 0 (0) | 1 | |
| Clinical stages 临床分期 | I | 3 (9.7) | 3 (16.7) | 0 (0) | 0.25 |
| II | 19 (61.3) | 11 (61.1) | 8 (61.5) | 1 | |
| III | 6 (19.4) | 3 (16.7) | 3 (23.1) | 0.68 | |
| IV | 3 (9.7) | 1 (5.6) | 2 (15.4) | 0.56 | |
Values are means ± SD or n (%). Differences between groups were tested by one-factor ANOVA followed by least significant difference post hoc tests. * indicates p<0.05.
值是 SD 或 n (%) ±平均值。通过单因素方差分析检验组间差异,然后进行差异最小显著的事后检验。* 表示 p<0.05。
Fig. 1. 图 1.
Skeletal muscle mass in the two groups, **Significant difference at p<0.01 between two groups. NC, non-cancer cachexia group; CC, cancer cachexia group; SMI, skeletal muscle index.
两组骨骼肌质量,**两组之间 p<0.01 差异显著。NC,非癌性恶病质组;CC, 癌症恶病质组;SMI,骨骼肌指数。
Cancer cachexia model establishment
癌症恶病质模型建立
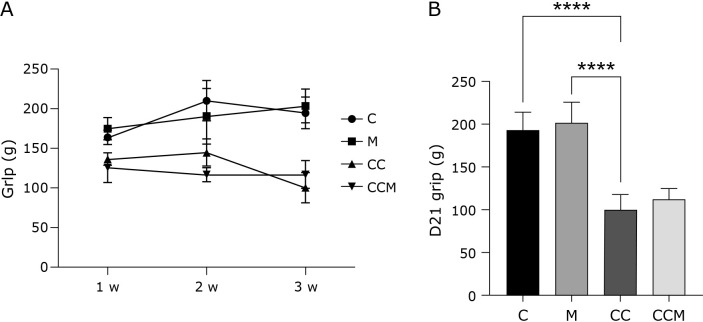
To establish a cancer cachexia model, C26 cells were injected subcutaneously in Balb/c mice. During the process, grip strength tests were performed weekly, and subjects loaded with tumors exhibited a gradual decline in muscle strength (Fig. 2A). Compared to the C and M groups, the CC and CCM groups exhibited lower grip strength at the end of the experiment (Fig. 2B). Meanwhile, we found that the autonomic activity of subjects with cancer cachexia declined weekly (Fig. 3A), exhibiting less activity compared to the C and M groups (Fig. 3B). These findings indicated that the cancer cachexia model was established successfully.
为了建立癌症恶病质模型,将 C26 细胞皮下注射到 Balb/c 小鼠中。在此过程中,每周进行握力测试,患有肿瘤的受试者表现出肌肉力量逐渐下降(图 2A)。与 C 组和 M 组相比,CC 和 CCM 组在实验结束时表现出较低的握力(图 2B)。同时,我们发现癌症恶病质受试者的自主神经活性每周下降(图 3A),与 C 组和 M 组相比表现出更少的活性(图 3B)。这些发现表明癌症恶病质模型建立成功。
Fig. 2. 图 2.
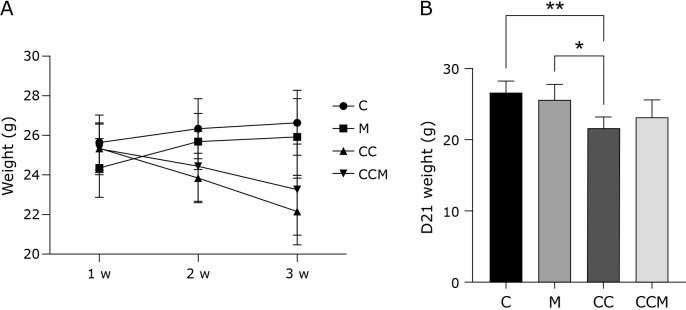
(A) Weight changes of subjects in the groups during 3 weeks of modeling. (B) Body weight at day 21 in each group. *Significant difference at p<0.05 between indicated groups, **Significant difference at p<0.01 between indicated groups. C, control group; M, mitophagy inhibited group; CC, cancer cachexia group; CCM, cancer cachexia + mitophagy inhibited group.
(A) 建模 3 周期间各组受试者的体重变化。(B) 每组第 21 天的体重。*指示组之间 p<0.05 处的显著差异,**指示组之间 p<0.01 处的显著差异。C, 对照组;M, 线粒体自噬抑制组;CC, 癌症恶病质组;CCM、癌症恶病质 + 线粒体自噬抑制组。
Fig. 3. 图 3.
(A) Grip changes of subjects in the groups during 3 weeks of modeling. (B) Mean ± SD grip at day 21 of each group. ****Significant difference at p<0.001 between indicated groups. C, control group; M, mitophagy inhibited group; CC, cancer cachexia group; CCM, cancer cachexia + mitophagy inhibited group.
(A) 建模 3 周期间各组中受试者的握力变化。(B) 每组第 21 天的平均 SD 握±力。指定组之间 p<0.001 处差异显著。C, 对照组;M, 线粒体自噬抑制组;CC, 癌症恶病质组;CCM、癌症恶病质 + 线粒体自噬抑制组。
Expression of mitophagy in skeletal muscles
线粒体自噬在骨骼肌中的表达
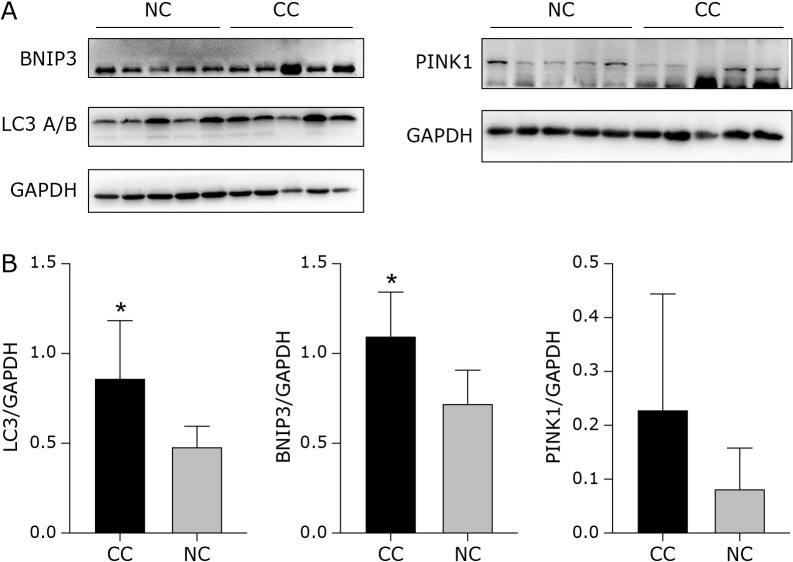
Western blot was performed to assess the expression of mitophagy protein in the rectus abdominis muscle of patients. PINK1 and Bnip3 proteins represent different pathways of mitophagy initiation, and LC3A/B protein was used to measure ALS marker expression. Bnip3 and LC3A/B protein expression were significantly higher in the cancer cachexia group, while no significant difference was observed in the PINK1 protein (Fig. 4), indicating mitophagy is partially activated in rectus abdominis muscles of patients with cancer cachexia.
Western blot 评估患者腹直肌中线粒体自噬蛋白的表达。PINK1 和 Bnip3 蛋白代表线粒体自噬起始的不同途径,LC3A/B 蛋白用于测量 ALS 标志物表达。Bnip3 和 LC3A/B 蛋白在癌症恶病质组中表达显著升高,而在 PINK1 蛋白中未观察到显著差异(图 4),表明癌症恶病质患者腹直肌中的线粒体自噬部分激活。
Fig. 4. 图 4.
Expression of mitophagy markers in rectus abdominis muscles of patients in the groups. LC3A/B, bnip3 and PINK1 protein expression was evaluated by Western blotting: protein expression was normalized using GAPDH as a loading control. *Significant difference at p<0.05 between two groups. NC, non-cancer cachexia group; CC, cancer cachexia group; LC3, microtubule associated protein 1 light chain 3 β; BNIP3, Bcl2 and adenovirus E1B19 kDa interacting protein 3; PINK1, PTEN-induced putative kinase 1.
各组患者腹直肌中线粒体自噬标志物的表达。通过 Western blotting 评估 LC3A/B 、 bnip3 和 PINK1 蛋白表达:使用 GAPDH 作为上样对照对蛋白表达进行归一化。*两组之间 p<0.05 的显著差异。NC,非癌性恶病质组;CC, 癌症恶病质组;LC3,微管相关蛋白 1 轻链 3 β;BNIP3、Bcl2 和腺病毒 E1B19 kDa 相互作用蛋白 3;PINK1,PTEN 诱导的推定激酶 1。
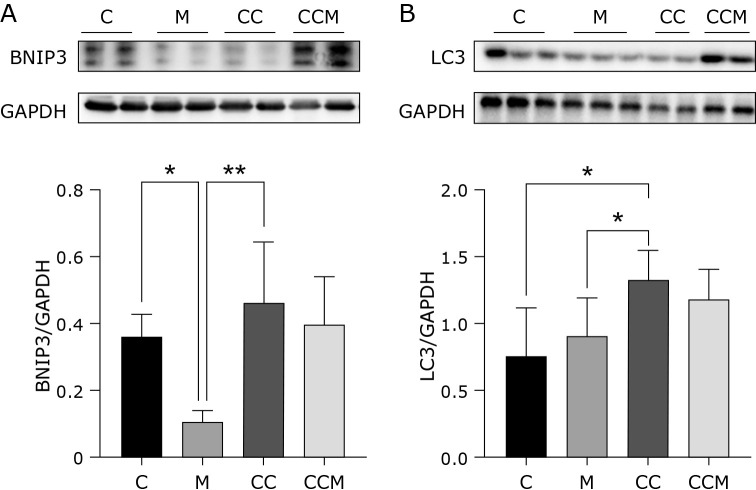
Gastrocnemius muscle specimens were acquired, and Western blots were performed to assess the expression of mitophagy in animal models. BNIP3 and LC3 proteins expression in the C group were relatively higher than the other 3 groups, and mice injected with Mdivi-1 exhibited lower expression of BNIP3 proteins (Fig. 5), indicating Mdivi-1 could suppress mitophagy activity. Mitophagy in cancer cachexia models was activated, similar to findings in human skeletal muscle.
获取腓肠肌标本,并进行 Western 印迹以评估动物模型中线粒体自噬的表达。C 组 BNIP3 和 LC3 蛋白表达相对高于其他 3 组,注射 Mdivi-1 的小鼠 BNIP3 蛋白表达较低 (图 5),表明 Mdivi-1 可以抑制线粒体自噬活性。癌症恶病质模型中的线粒体自噬被激活,类似于人类骨骼肌中的发现。
Fig. 5. 图 5.
Expression of mitophagy markers in gastrocnemius muscles of subjects in the groups. Bnip3 and LC3 protein expression was evaluated by Western blotting: protein expression was normalized using GAPDH as a loading control. *Significant difference at p<0.05 between two groups. **Significant difference at p<0.01 between two groups. C, control group; M, mitophagy inhibited group; CC, cancer cachexia group; CCM, cancer cachexia + mitophagy inhibited group; LC3, microtubule associated protein 1 light chain 3 β; BNIP3, Bcl2 and adenovirus E1B19 kDa interacting protein 3.
各组受试者腓肠肌中线粒体自噬标志物的表达。通过 Western blotting 评估 Bnip3 和 LC3 蛋白表达:使用 GAPDH 作为上样对照对蛋白表达进行归一化。*两组之间 p<0.05 处差异显著。**两组之间 p<0.01 处差异显著。C, 对照组;M, 线粒体自噬抑制组;CC, 癌症恶病质组;CCM、癌症恶病质 + 线粒体自噬抑制组;LC3,微管相关蛋白 1 轻链 3 β;BNIP3、Bcl2 和腺病毒 E1B19 kDa 相互作用蛋白 3。
Expression of inflammatory factors
炎症因子的表达
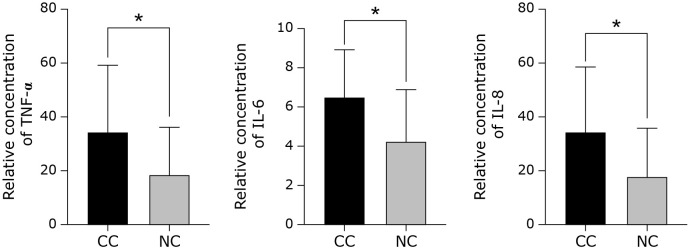
To evaluate systemic inflammatory reaction, we obtained blood samples preoperatively and found that TNF-α, IL-6, and IL-8 were elevated in the cancer cachexia group (Fig. 6). The results suggested that the inflammatory reaction was overactivated in patients with cancer cachexia.
为了评估全身炎症反应,我们在术前采集了血样,发现癌症恶病质组的 TNF-α、IL-6 和 IL-8 升高 (图 6)。结果表明,癌症恶病质患者的炎症反应被过度激活。
Fig. 6. 图 6.
Expression of inflammatory factors in serum of patients in the groups. TNF-α, IL-6, and IL-6 expression was evaluated by ELISA. *Significant difference at p<0.05 between two groups. NC, non-cancer cachexia group; CC, cancer cachexia group.
各组患者血清中炎症因子的表达。ELISA 评估 TNF-α 、 IL-6 和 IL-6 表达。*两组之间 p<0.05 的显著差异。NC,非癌性恶病质组;CC, 癌症恶病质组。
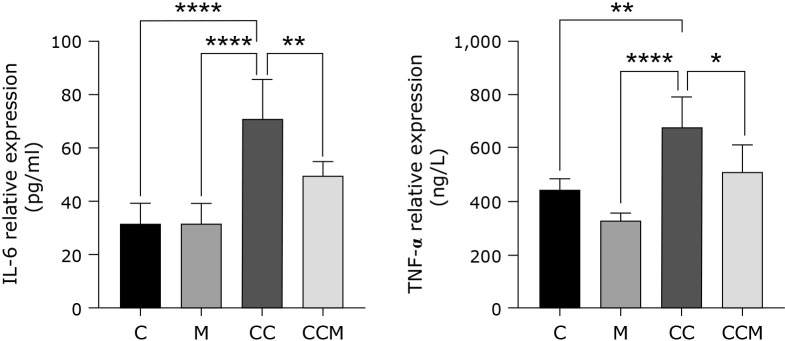
ELISA was performed to determine the relative expression of IL-6 and TNF-α in the skeletal muscle of animal models. CC group showed a higher concentration of inflammatory factors than the CCM group and the other 2 groups (Fig. 7), indicating the enhanced mitophagy activity was closely related to the inflammatory reaction in skeletal muscle with cancer cachexia.
ELISA 测定动物模型骨骼肌中 IL-6 和 TNF-α 的相对表达。CC 组的炎症因子浓度高于 CCM 组和其他 2 组 (图 7),表明增强的线粒体自噬活性与骨骼肌中癌症恶病质的炎症反应密切相关。
Fig. 7. 图 7.
Expression of inflammatory factors in gastrocnemius muscles of subjects in the groups. IL-6 and TNF-α expression was evaluated by ELISA. *Significant difference at p<0.05 between two groups. **Significant difference at p<0.01 between two groups. ****Significant difference at p<0.001 between two groups. C, control group; M, mitophagy inhibited group; CC, cancer cachexia group; CCM, cancer cachexia + mitophagy inhibited group.
各组受试者腓肠肌中炎症因子的表达。ELISA 评估 IL-6 和 TNF-α 表达。*两组之间 p<0.05 处差异显著。**两组之间 p<0.01 处差异显著。****两组之间 p<0.001 处差异显著。C, 对照组;M, 线粒体自噬抑制组;CC, 癌症恶病质组;CCM、癌症恶病质 + 线粒体自噬抑制组。
Skeletal muscle fiber area
骨骼肌纤维面积
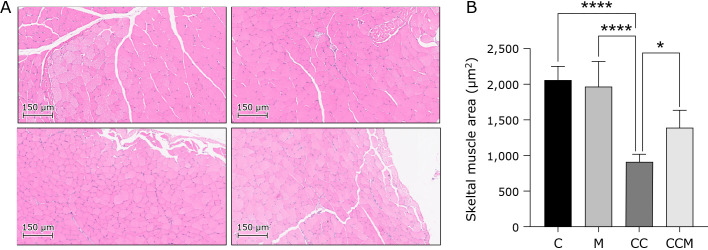
Gastrocnemius muscle sections stained with hematoxylin and eosin were observed under an optical microscope. Cross-sectional observations showed that skeletal muscle fibers were sparsely arranged and less regulated in the CC group compared with the other 3 groups (Fig. 8A). Meanwhile, the muscle fiber cross-sectional area was significantly decreased in the CC group (Fig. 8B). Although the CCM group exhibited a loss of skeletal muscle fiber, the severity was milder compared to the CC group, indicating mitophagy overactivation.
在光学显微镜下观察苏木精和伊红染色的腓肠肌切片。横断面观察显示,与其他 3 组相比,CC 组的骨骼肌纤维排列稀疏且调节较少(图 8A)。同时,CC 组的肌纤维横截面积显着减少(图 8B)。虽然 CCM 组表现出骨骼肌纤维的丢失,但与 CC 组相比,严重程度较轻,表明线粒体自噬过度激活。
Fig. 8. 图 8.
Muscle fiber morphology and cross-sectional area of gastrocnemius muscle fibers of subjects in each group. (A) Representative hematoxylin and eosin–stained gastrocnemius muscle sections from each group. In cross-sections, the gastrocnemius muscle fibers were round and compactly arranged in the C and M groups. Atrophy was observed in the CC and CCM groups, which manifested as sparsely arranged shrinking triangles or polygons. (B) Mean ± SD cross-sectional areas of muscle fibers in the gastrocnemius muscle of each group. *Significant difference at p<0.05 between indicated groups. ****Significant difference at p<0.001 between indicated groups. C, control group; M, mitophagy inhibited group; CC, cancer cachexia group; CCM, cancer cachexia + mitophagy inhibited group.
每组受试者的肌纤维形态和腓肠肌纤维横截面积。(A) 每组代表性的苏木精和伊红染色的腓肠肌切片。在横截面中,腓肠肌纤维呈圆形,紧密排列在 C 组和 M 组中。CC 和 CCM 组观察到萎缩,表现为稀疏排列的收缩三角形或多边形。(B) 每组腓肠肌中肌纤维的平均 SD 横截面积±。*指示组之间 p<0.05 处的显著差异。****指示组之间 p<0.001 处的显著差异。C, 对照组;M, 线粒体自噬抑制组;CC, 癌症恶病质组;CCM、癌症恶病质 + 线粒体自噬抑制组。
Expression of skeletal muscle atrophy protein
骨骼肌萎缩蛋白的表达
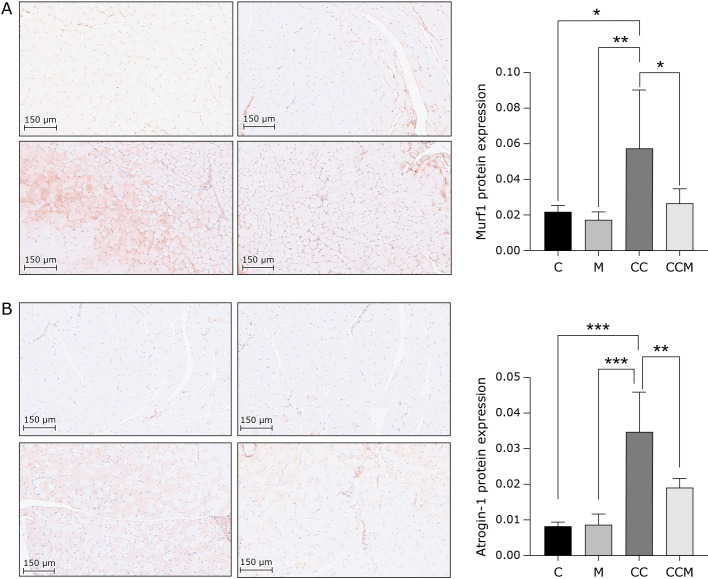
We performed immunohistochemistry to assess the expression of Murf1 and atrogin1 protein to observe the degree of skeletal muscle atrophy. The results showed that the expression of Murf1 in the CC group was higher than the other 3 groups (Fig. 9A), while atrogin1 protein exhibited higher expression (Fig. 9B). This finding suggested that mitophagy overactivation might be related to skeletal muscle atrophy.
我们进行免疫组化以评估 Murf1 和 atrogin1 蛋白的表达,以观察骨骼肌萎缩的程度。结果显示,CC 组中 Murf1 的表达高于其他 3 组(图 9A),而 atrogin1 蛋白的表达较高(图 9B)。这一发现表明线粒体自噬过度激活可能与骨骼肌萎缩有关。
Fig. 9. 图 9.
Muscle atrophy protein expression of gastrocnemius muscle fibers of subjects in the groups. (A) IHC of gastrocnemius muscle sections from each group. Murf1 and atrogin1 protein was observed in the CC and CCM groups. (B) Mean ± SD of Murf1 and atrogin1 protein expression in the gastrocnemius muscle of each group. *Significant difference at p<0.05 between indicated groups. **Significant difference at p<0.01 between indicated groups. ***Significant difference at p<0.005 between indicated groups. C, control group; M, mitophagy inhibited group; CC, cancer cachexia group; CCM, cancer cachexia + mitophagy inhibited group.
组内受试者腓肠肌纤维的肌肉萎缩蛋白表达。(A) 每组腓肠肌切片的 IHC。在 CC 和 CCM 组中观察到 Murf1 和 atrogin1 蛋白。(B) 每组腓肠肌中 Murf1 和 atrogin1 蛋白表达的平均 ± SD 值。*指示组之间 p<0.05 处的显著差异。**指示组之间 p<0.01 处的显著差异。***指示组之间 p<0.005 处的显著差异。C, 对照组;M, 线粒体自噬抑制组;CC, 癌症恶病质组;CCM、癌症恶病质 + 线粒体自噬抑制组。
Ultrastructural muscle architecture
超微结构肌肉结构
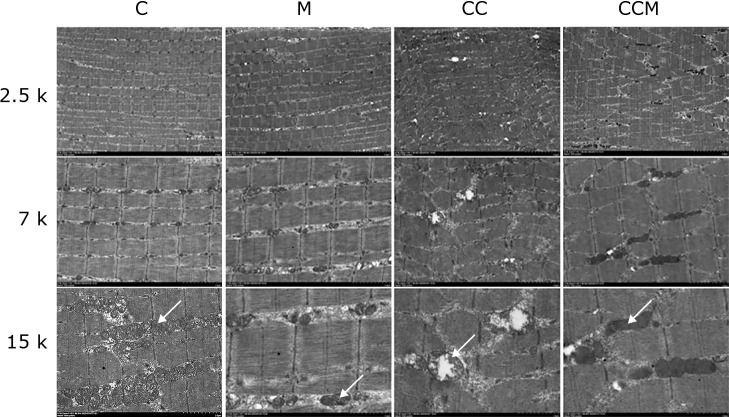
The structure and arrangement of skeletal muscle fiber and mitochondria of gastrocnemius muscles were observed under electron microscopy. The CC group exhibited a disorganized sarcomere arrangement with swollen and broken mitochondria, while mitochondria in the M and CCM groups were merged and presented with clearer cristae (Fig. 10), indicating that cancer cachexia has a negative influence on mitochondria structure.
在电子显微镜下观察腓肠肌骨骼肌纤维和线粒体的结构和排列。CC 组表现出杂乱无章的肌节排列,线粒体肿胀和断裂,而 M 和 CCM 组的线粒体合并并呈现出更清晰的嵴(图 10),表明癌症恶病质对线粒体结构有负面影响。
Fig. 10. 图 10.
Representative ultrastructural images of the vastus lateralis in the groups. Myofilaments were oriented in parallel with well-organized sarcomeres and mitochondria was regularly aligned on both sides of the Z-lines in C and M group muscles. Disorganized sarcomere arrangement with swelled and broken mitochondria were seen in CC group while mitochondria in M group and CCM group were merged and presented a clearer crest. Mitochondria in different groups were pointed with white arrows. C, control group; M, mitophagy inhibited group; CC, cancer cachexia group; CCM, cancer cachexia + mitophagy inhibited group.
各组中股外侧肌的代表性超微结构图像。肌丝与组织良好的肌节平行定向,线粒体在 C 和 M 组肌肉的 Z 线两侧规则地排列。CC 组可见无序的肌节排列伴线粒体肿胀和断裂,而 M 组和 CCM 组的线粒体合并并呈现更清晰的嵴。不同组的线粒体用白色箭头指向。C, 对照组;M, 线粒体自噬抑制组;CC, 癌症恶病质组;CCM、癌症恶病质 + 线粒体自噬抑制组。
Mitochondrial function 线粒体功能
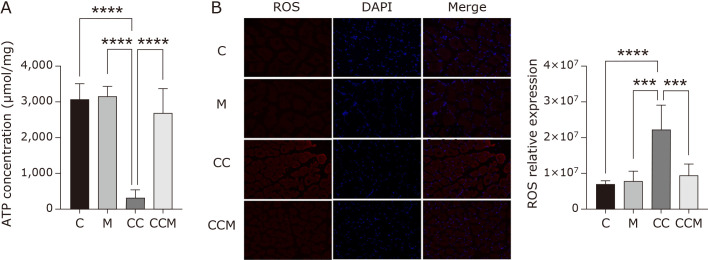
ATP concentration was used to mirror the mitochondrial energy supply. Compared to the other 3 groups, the concentration of ATP was significantly decreased in the CC group, and energy deficiency was less obvious in the CCM group (Fig. 11A).
ATP 浓度用于反映线粒体能量供应。与其他 3 组相比,CC 组 ATP 浓度显著降低,CCM 组能量不足不太明显(图 11A)。
Fig. 11. 图 11.
Mitochondria function of gastrocnemius muscle fibers of subjects in the groups. (A) ATP concentration in the gastrocnemius muscle of each group. (B) ROS expression in the gastrocnemius muscle of each group. ***Significant difference at p<0.005 between indicated groups. ****Significant difference at p<0.001 between indicated groups. C, control group; M, mitophagy inhibited group; CC, cancer cachexia group; CCM, cancer cachexia + mitophagy inhibited group. ATP, adenosine triphosphate; ROS, reactive oxygen species; DAPI, 4',6-diamidino-2-phenylindole.
各组受试者腓肠肌纤维的线粒体功能。(A) 每组腓肠肌中的 ATP 浓度。(B) 每组腓肠肌中 ROS 的表达。指示组之间 p<0.005 处差异显著。****指示组之间 p<0.001 处差异显著。C, 对照组;M, 线粒体自噬抑制组;CC, 癌症恶病质组;CCM、癌症恶病质 + 线粒体自噬抑制组。ATP,三磷酸腺苷;ROS,活性氧;DAPI,4',6-二脒基-2-苯基吲哚。
It is widely acknowledged that ROS immunofluorescence can be used to visualize the cellular levels of oxidative stress. ROS were highly expressed in the CC group compared to the CCM group (Fig. 11B), indicating enhanced mitophagy activity might be closely related to oxidative stress in skeletal muscle with cancer cachexia.
人们普遍认为,ROS 免疫荧光可用于可视化氧化应激的细胞水平。与 CCM 组相比,CC 组 ROS 高表达(图 11B),表明增强的线粒体自噬活性可能与癌症恶病质骨骼肌的氧化应激密切相关。
Discussion 讨论
In our study, patients with cancer cachexia presented a loss of skeletal muscle and activation of mitophagy, as well as systemic inflammatory reactions. Based on these findings, we established a cancer cachexia animal model, and through Mdivi-1 intraperitoneal injection, mitophagy activity was suppressed in M and CCM groups to observe the relationship between skeletal muscle dysfunction and mitophagy in cancer cachexia. Furthermore, inflammation and oxidative stress in skeletal muscle with cancer cachexia were assessed to primarily explore the mechanism of mitophagy-induced skeletal muscle injury.
在我们的研究中,癌症恶病质患者表现为骨骼肌丧失和线粒体自噬激活,以及全身炎症反应。基于这些发现,我们建立了癌症恶病质动物模型,并通过 Mdivi-1 腹腔注射,抑制 M 和 CCM 组的线粒体自噬活性,观察癌症恶病质中骨骼肌功能障碍与线粒体自噬的关系。此外,评估癌症恶病质骨骼肌的炎症和氧化应激,主要探讨线粒体自噬诱导骨骼肌损伤的机制。
Patients with gastrointetinal cancer were recruited in this study. To ensure accuracy of our findings, strict inclusion and exclusion criteria were established to minimize the influence of confounding factors on skeletal muscle structure and function disability, enhanced inflammatory reaction and oxidative reaction. Patients recruited in the control group and cancer cachexia group exhibited no significant difference in age, sex and other basic characteristics. Compared with the control group, patients in the cancer cachexia group exhibited lower serum albumin and higher NRS-2002 score. Meanwhile, CT scan images of the third lumbar vertebra layer showed that SMI in the cancer cachexia group was significantly lower than the control group, indicating skeletal muscle loss in patients with cancer cachexia, which is in accordance with previous studies. It has been established that autophagy activity is increased in the skeletal muscle of patients with cancer cachexia, which was also observed in our study with an elevation of LC3A/B protein. In recent years, PINK1 and BNIP3 proteins have been associated with important mitophagy pathways.(21,22) The present study showed that BNIP3 protein expression was elevated in the skeletal muscle, while PINK1 protein levels were comparable between the two groups, consistent with a previous study,(23) suggesting that mitophagy is unduly expressed in the skeletal muscle of patients with cancer cachexia through different pathways. We also found that compared to the control group, the cancer cachexia group exhibited a higher level of inflammatory factors. Previous study have revealed that preemptive administration of TNF-α antibody might mitigate cancer cachexia, indicating an important role of inflammatory factors in the development of cancer cachexia.(24) There is a growing consensus that increased inflammatory reaction and mitophagy activation occur separately.(23,25,26) In our study, mitophagy and systemic inflammatory reaction were exacerbated at the same time, emphasizing the need for future research on their relationship.
本研究招募了胃酸癌患者。为了确保我们研究结果的准确性,建立了严格的纳入和排除标准,以尽量减少混杂因素对骨骼肌结构和功能残疾、增强炎症反应和氧化反应的影响。对照组和癌症恶病质组招募的患者在年龄、性别和其他基本特征上无显著差异。与对照组相比,癌症恶病质组患者血清白蛋白较低,NRS-2002 评分较高。同时,第三腰椎层 CT 扫描图像显示,癌症恶病质组的 SMI 显著低于对照组,表明癌症恶病质患者的骨骼肌损失,这与以前的研究一致。已经确定癌症恶病质患者骨骼肌中的自噬活性增加,在我们的研究中也观察到 LC3A/B 蛋白升高。近年来,PINK1 和 BNIP3 蛋白与重要的线粒体自噬途径相关。(21,22)目前的研究表明,BNIP3 蛋白在骨骼肌中的表达升高,而两组之间的 PINK1 蛋白水平相当,这与之前的研究一致,(23) 表明线粒体自噬通过不同的途径在癌症恶病质患者的骨骼肌中过度表达。我们还发现,与对照组相比,癌症恶病质组表现出更高水平的炎症因子。 先前的研究表明,抢先给予 TNF-α 抗体可能会减轻癌症恶病质,表明炎症因子在癌症恶病质的发展中起重要作用。(24) 越来越多的共识是炎症反应增加和线粒体自噬激活是分开发生的。(23,25,26)在我们的研究中,线粒体自噬和全身炎症反应同时加剧,强调了未来研究它们关系的必要性。
The cancer cachexia model and mitophagy suppression model were established and we observed alterations in their skeletal muscle structure, functions, inflammation, and oxidative stress. Patients with cancer cachexia exhibited smaller skeletal muscle fiber areas and higher expression of skeletal muscle atrophy protein MURF1 and atrogin-1. By injecting Mdivi-1 consecutively for a week, mitochondria number and structure were rescued compared to the C group. ATP concentration was elevated and oxidative stress was suppressed in CCM group though with cancer cachexia, inflammatory factors IL-6 and TNF-α were also decreased comparing to CC group. These results indicate that mitophagy is unduly stimulated in the skeletal muscle of subjects with cancer cachexia, accompanied by an inflammatory reaction and oxidative stress, which might be responsible for skeletal muscle loss and dysfunction to a certain extent.
建立了癌症恶病质模型和线粒体自噬抑制模型,我们观察到其骨骼肌结构、功能、炎症和氧化应激的变化。癌症恶病质患者表现出较小的骨骼肌纤维区域和较高的骨骼肌萎缩蛋白 MURF1 和 atrogin-1 表达。通过连续注射 Mdivi-1 一周,与 C 组相比,线粒体数量和结构得以挽救。CCM 组 ATP 浓度升高,氧化应激受到抑制,但与 CC 组相比,癌症恶病质、炎症因子 IL-6 和 TNF-α 也降低。这些结果表明,线粒体自噬在癌症恶病质受试者的骨骼肌中受到过度刺激,并伴有炎症反应和氧化应激,这可能在一定程度上导致骨骼肌流失和功能障碍。
Although we revealed a potential link between mitophagy and skeletal muscle loss in cancer cachexia, some limitations and shortcomings were found in this study. Indeed, it has been established that Mdivi-1 inhibits mitophagy and suppresses the Drp1 protein.(27,28) However, little is known about the influence of mitochondrial dynamics, nor is it clear how mitophagy influences inflammation and oxidative stress, warranting further study.(29,30) Further research based on cell experiments will be conducted in our future studies to explain the relationship between mitophagy and skeletal muscle loss.
尽管我们揭示了癌症恶病质中线粒体自噬与骨骼肌损失之间的潜在联系,但本研究发现了一些局限性和缺点。事实上,已经确定 Mdivi-1 抑制线粒体自噬并抑制 Drp1 蛋白。(27,28)然而,人们对线粒体动力学的影响知之甚少,也不清楚线粒体自噬如何影响炎症和氧化应激,值得进一步研究。(29,30)在我们未来的研究中将进行基于细胞实验的进一步研究,以解释线粒体自噬与骨骼肌损失之间的关系。
In conclusion, mitophagy is enhanced in the skeletal muscle of subjects with cancer cachexia. Inflammation and oxidative stress were also observed simultaneously. Overall, suppressing mitophagy could rescue mitochondrial function and skeletal muscle loss to a certain extent. Indeed, further research on mitophagy and cancer cachexia is essential to improve the outcomes of this patient population.
总之,线粒体自噬在癌症恶病质受试者的骨骼肌中增强。还同时观察到炎症和氧化应激。总体而言,抑制线粒体自噬可以在一定程度上挽救线粒体功能和骨骼肌损失。事实上,对线粒体自噬和癌症恶病质的进一步研究对于改善该患者群体的预后至关重要。
Author Contributions 作者贡献
ST and ZZ had equal contributions to this study. GW supervised the entire project. ST designed the study. ZZ, SL, YC, JW, HL, and MY performed study. ZZ and MY conducted data analyses. ZZ and ST wrote and revised the manuscript. All authors critically reviewed and approved the final manuscript.
ST 和 ZZ 对本研究的贡献相同。GW 监督了整个项目。ST 设计了这项研究。ZZ、SL、YC、JW、HL 和 MY 进行了研究。ZZ 和 MY 进行了数据分析。ZZ 和 ST 编写并修改了手稿。所有作者都严格审查并批准了最终手稿。
Acknowledgments 确认
Authors would like to thank all researchers and patients for the great cooperation and valuable contribution in this study. This study was funded by Shanghai “Rising Stars of Medical Talent” Youth Development Program ([2022]65), and Excellent Young Program of Zhongshan Hospital, Fudan University (2021ZSYQ14).
作者要感谢所有研究人员和患者对本研究的大力合作和宝贵贡献。本研究由上海市“医学人才明日之星”青年发展计划 ([2022]65) 和复旦大学附属中山医院优秀青年计划 (2021ZSYQ14) 资助。
Conflict of Interest
No potential conflicts of interest were disclosed.
References
- 1.Fearon K, Strasser F, Anker SD, et al. Definition and classification of cancer cachexia: an international consensus. Lancet Oncol 2011; 12: 489–495. [DOI] [PubMed] [Google Scholar]
- 2.Schmidt SF, Rohm M, Herzig S, Berriel Diaz M. Cancer cachexia: more than skeletal muscle wasting. Trends Cancer 2018; 4: 849–860. [DOI] [PubMed] [Google Scholar]
- 3.Anandavadivelan P, Lagergren P. Cachexia in patients with oesophageal cancer. Nat Rev Clin Oncol 2016; 13: 185–198. [DOI] [PubMed] [Google Scholar]
- 4.Zhang Y, Wang J, Wang X, et al. The autophagic-lysosomal and ubiquitin proteasome systems are simultaneously activated in the skeletal muscle of gastric cancer patients with cachexia. Am J Clin Nutr 2020; 111: 570–579. [DOI] [PubMed] [Google Scholar]
- 5.Tardif N, Klaude M, Lundell L, Thorell A, Rooyackers O. Autophagic-lysosomal pathway is the main proteolytic system modified in the skeletal muscle of esophageal cancer patients. Am J Clin Nutr 2013; 98: 1485–1492. [DOI] [PubMed] [Google Scholar]
- 6.Glick D, Barth S, Macleod KF. Autophagy: cellular and molecular mechanisms. J Pathol 2010; 221: 3–12. [DOI] [PMC free article] [PubMed] [Google Scholar]
- 7.Parzych KR, Klionsky DJ. An overview of autophagy: morphology, mechanism, and regulation. Antioxid Redox Signal 2014; 20: 460–473. [DOI] [PMC free article] [PubMed] [Google Scholar]
- 8.Kitada M, Koya D. Autophagy in metabolic disease and ageing. Nat Rev Endocrinol 2021; 17: 647–661. [DOI] [PubMed] [Google Scholar]
- 9.Ashrafi G, Schwarz TL. The pathways of mitophagy for quality control and clearance of mitochondria. Cell Death Differ 2013; 20: 31–42. [DOI] [PMC free article] [PubMed] [Google Scholar]
- 10.Bernardini JP, Lazarou M, Dewson G. Parkin and mitophagy in cancer. Oncogene 2017; 36: 1315–1327. [DOI] [PubMed] [Google Scholar]
- 11.Zhang J, Ney PA. Role of BNIP3 and NIX in cell death, autophagy, and mitophagy. Cell Death Differ 2009; 16: 939–946. [DOI] [PMC free article] [PubMed] [Google Scholar]
- 12.Chen M, Chen Z, Wang Y, et al. Mitophagy receptor FUNDC1 regulates mitochondrial dynamics and mitophagy. Autophagy 2016; 12: 689–702. [DOI] [PMC free article] [PubMed] [Google Scholar]
- 13.Manczak M, Kandimalla R, Yin X, Reddy PH. Mitochondrial division inhibitor 1 reduces dynamin-related protein 1 and mitochondrial fission activity. Hum Mol Genet 2019; 28: 177–199. [DOI] [PMC free article] [PubMed] [Google Scholar]
- 14.Archer SL. Mitochondrial dynamics--mitochondrial fission and fusion in human diseases. N Engl J Med 2013; 369: 2236–2251. [DOI] [PubMed] [Google Scholar]
- 15.Favaro G, Romanello V, Varanita T, et al. DRP1-mediated mitochondrial shape controls calcium homeostasis and muscle mass. Nat Commun 2019; 10: 2576. [DOI] [PMC free article] [PubMed] [Google Scholar]
- 16.Mao X, Gu Y, Sui X, et al. Phosphorylation of dynamin-related protein 1 (DRP1) regulates mitochondrial dynamics and skeletal muscle wasting in cancer cachexia. Front Cell Dev Biol 2021; 9: 673618. [DOI] [PMC free article] [PubMed] [Google Scholar]
- 17.Wang J, Zhu P, Li R, Ren J, Zhou H. Fundc1-dependent mitophagy is obligatory to ischemic preconditioning-conferred renoprotection in ischemic AKI via suppression of Drp1-mediated mitochondrial fission. Redox Biol 2020; 30: 101415. [DOI] [PMC free article] [PubMed] [Google Scholar]
- 18.Zhang Z, Chen Z, Liu R, et al. Bcl-2 proteins regulate mitophagy in lipopolysaccharide-induced acute lung injury via PINK1/Parkin signaling pathway. Oxid Med Cell Longev 2020; 2020: 6579696. [DOI] [PMC free article] [PubMed] [Google Scholar]
- 19.He F, Huang Y, Song Z, et al. Mitophagy-mediated adipose inflammation contributes to type 2 diabetes with hepatic insulin resistance. J Exp Med 2021; 218: e20201416. [DOI] [PMC free article] [PubMed] [Google Scholar]
- 20.Pradeepkiran JA, Reddy PH. Defective mitophagy in Alzheimer’s disease. Ageing Res Rev 2020; 64: 101191. [DOI] [PMC free article] [PubMed] [Google Scholar]
- 21.Lazarou M, Sliter DA, Kane LA, et al. The ubiquitin kinase PINK1 recruits autophagy receptors to induce mitophagy. Nature 2015; 524: 309–314. [DOI] [PMC free article] [PubMed] [Google Scholar]
- 22.Lin Q, Li S, Jiang N, et al. Inhibiting NLRP3 inflammasome attenuates apoptosis in contrast-induced acute kidney injury through the upregulation of HIF1A and BNIP3-mediated mitophagy. Autophagy 2021; 17: 2975–2990. [DOI] [PMC free article] [PubMed] [Google Scholar]
- 23.Aversa Z, Pin F, Lucia S, et al. Autophagy is induced in the skeletal muscle of cachectic cancer patients. Sci Rep 2016; 6: 30340. [DOI] [PMC free article] [PubMed] [Google Scholar]
- 24.Kang EA, Park JM, Jin W, Tchahc H, Kwon KA, Hahm KB. Amelioration of cancer cachexia with preemptive administration of tumor necrosis factor-α blocker. J Clin Biochem Nutr 2022; 70: 117–128. [DOI] [PMC free article] [PubMed] [Google Scholar]
- 25.Zhang Q, Song MM, Zhang X, et al. Association of systemic inflammation with survival in patients with cancer cachexia: results from a multicentre cohort study. J Cachexia Sarcopenia Muscle 2021; 12: 1466–1476. [DOI] [PMC free article] [PubMed] [Google Scholar]
- 26.Martin L, Muscaritoli M, Bourdel-Marchasson I, et al. Diagnostic criteria for cancer cachexia: reduced food intake and inflammation predict weight loss and survival in an international, multi-cohort analysis. J Cachexia Sarcopenia Muscle 2021; 12: 1189–1202. [DOI] [PMC free article] [PubMed] [Google Scholar]
- 27.Mizumura K, Cloonan SM, Nakahira K, et al. Mitophagy-dependent necroptosis contributes to the pathogenesis of COPD. J Clin Invest 2014; 124: 3987–4003. [DOI] [PMC free article] [PubMed] [Google Scholar]
- 28.Bordt EA, Clerc P, Roelofs BA, et al. The putative Drp1 inhibitor mdivi-1 is a reversible mitochondrial complex I inhibitor that modulates reactive oxygen species. Dev Cell 2017; 40: 583–594.e6. [DOI] [PMC free article] [PubMed] [Google Scholar]
- 29.Wang Y, Jasper H, Toan S, Muid D, Chang X, Zhou H. Mitophagy coordinates the mitochondrial unfolded protein response to attenuate inflammation-mediated myocardial injury. Redox Biol 2021; 45: 102049. [DOI] [PMC free article] [PubMed] [Google Scholar]
- 30.Sliter DA, Martinez J, Hao L, et al. Parkin and PINK1 mitigate STING-induced inflammation. Nature 2018; 561: 258–262. [DOI] [PMC free article] [PubMed] [Google Scholar]


