
Updated in October 2022 更新于 2022 年 10 月
- Mnova MSChrom is a piece of desktop software for LC/GC-MS and tandem MS (or MS-MS) processing, analysis, and reporting.
Mnova MSChrom 是一款用于 LC/GC-MS 和串联 MS(或 MS-MS)处理、分析和报告的桌面软件。 - One software fits all:
一软件通所有:- Opens the raw datatypes used by various LC/GC-MS vendors
打开各种 LC/GC-MS 供应商使用的原始数据类型 - Can work together with NMR and IR/UV data seamlessly
可以无缝与 NMR 和 IR/UV 数据协作
- Opens the raw datatypes used by various LC/GC-MS vendors
- Visualization, annotation, and reporting made easy
可视化、注释和报告变得简单- PowerPoint-like, multi-page, and multi-document graphical interface
类似于 PowerPoint 的,多页的,多文档的图形界面 - Setup of initial display: TIC, mass spec, UV traces, and alignment of traces
初始显示设置:TIC,质谱,UV 轨迹,以及轨迹对齐 - User-defined display templates for easy reporting
用户自定义的显示模板,便于报告
- PowerPoint-like, multi-page, and multi-document graphical interface
- Powerful analysis tools for:
强大的分析工具适用于:- Extracted ion chromatograms to locate expected ions
提取离子色谱图以定位预期的离子 - Automatic peak integration with easy manual correction
自动峰值积分,易于手动修正 - Elemental composition enumeration, molecule match, mol. ion and isotope cluster prediction
元素组成枚举,分子匹配,分子离子和同位素簇预测 - Molecular match that automatically matches the expected molecular ion and isotope cluster patterns starting from a molecular structure or MF with different adducts and losses considered
分子匹配,自动匹配预期的分子离子和同位素簇模式,从分子结构或 MF 开始,考虑不同的附加物和损失 - Elemental composition enumeration from high-resolution mass spectrum
高分辨率质谱的元素组成列举 - Isotope cluster prediction starting from a molecular formula, with different adducts/losses considered
从分子式开始预测同位素簇,考虑不同的附加物/损失
- Extracted ion chromatograms to locate expected ions
- Batch or real-time data processing and databasing
批处理或实时数据处理和数据库操作- Scripting engine included (javascript)
包含脚本引擎(javascript) - Real-time or batch processing and reporting (with Mnova Gears)
实时或批处理和报告(使用 Mnova Gears) - Database management of raw data and analysis results (with Mnova DB)
数据库管理原始数据和分析结果(使用 Mnova DB) - Communication with ELN (Customization development with Mestrelab)
与 ELN 的通信(与 Mestrelab 的定制开发)
- Scripting engine included (javascript)
Learn how to get your first results in a few minutes with Mnova MSChrom:
学习如何在几分钟内使用 Mnova MSChrom 获得第一个结果:
The scope of this guide is to get you started in the use of MSChrom. For further information please check out our manual that you can find on either of our downloads and Mnova pages.
本指南的范围是帮助您开始使用 MSChrom。如需更多信息,请参阅我们手册,您可以在我们的下载和 Mnova 页面上找到。
Drag and drop the raw file to Mnova to display the TIC and MS spectrum of the highest signal. Alternatively use ‘File > Open’). The MS Browser will be automatically displayed, and the Mass/Tools ribbon automatically activated. For example, open the QuinineMS.d dataset from the Mnova Examples*.
将原始文件拖放到 Mnova 中以显示最高信号的 TIC 和 MS 光谱。或者使用“文件>打开”。MS 浏览器将自动显示,工具/质量条带也将自动激活。例如,打开 Mnova 示例中的 QuinineMS.d 数据集。
*Note: You can find the Mnova dataset examples included in the application by following the path 'Help > Download Examples'
* 注意:您可以通过遵循路径 '帮助 > 下载示例' 在应用程序中找到 Mnova 数据集示例

If it is available, the PDA total absorbance chromatogram will be displayed at the top of the page. (TIP: The data to display when loading a new mass item can be configured in the ‘Setup’ tab for the Mass Preferences).
如果可用,PDA 总吸收色谱图将在页面顶部显示。 (提示:加载新质量项时要显示的数据可以在质量偏好设置的“设置”标签中进行配置。)
The MS Browser mentioned above contains very useful information, for instance about your LC-MS experiments. You can open the TIC, Base Peak or the Mass Spectrum through the Function section, extract an UV trace by clicking on the DAD Trace, and generally navigate through all your data.
上述提到的 MS 浏览器包含非常有用的信息,例如关于您的 LC-MS 实验。您可以通过功能部分打开 TIC、基峰或质谱,通过点击 DAD 迹线提取 UV 迹线,并一般浏览所有您的数据。


Use the 'Zoom in' tool to show details in any plot. (Use the 'Z' Key as a shortcut or the corresponding 'View' icon on the toolbar).
使用“放大”工具在任何图表中显示详细信息。(使用“Z”键作为快捷方式,或工具栏上的相应“视图”图标。)

Manually edit the peak range by dragging the integral wedges that indicate the peak range (hold down 'Shift' while moving a wedge to move them freely).
手动编辑峰范围,通过拖动表示峰范围的积分楔形。在移动楔形时按住'Shift'键,可以自由移动它们。
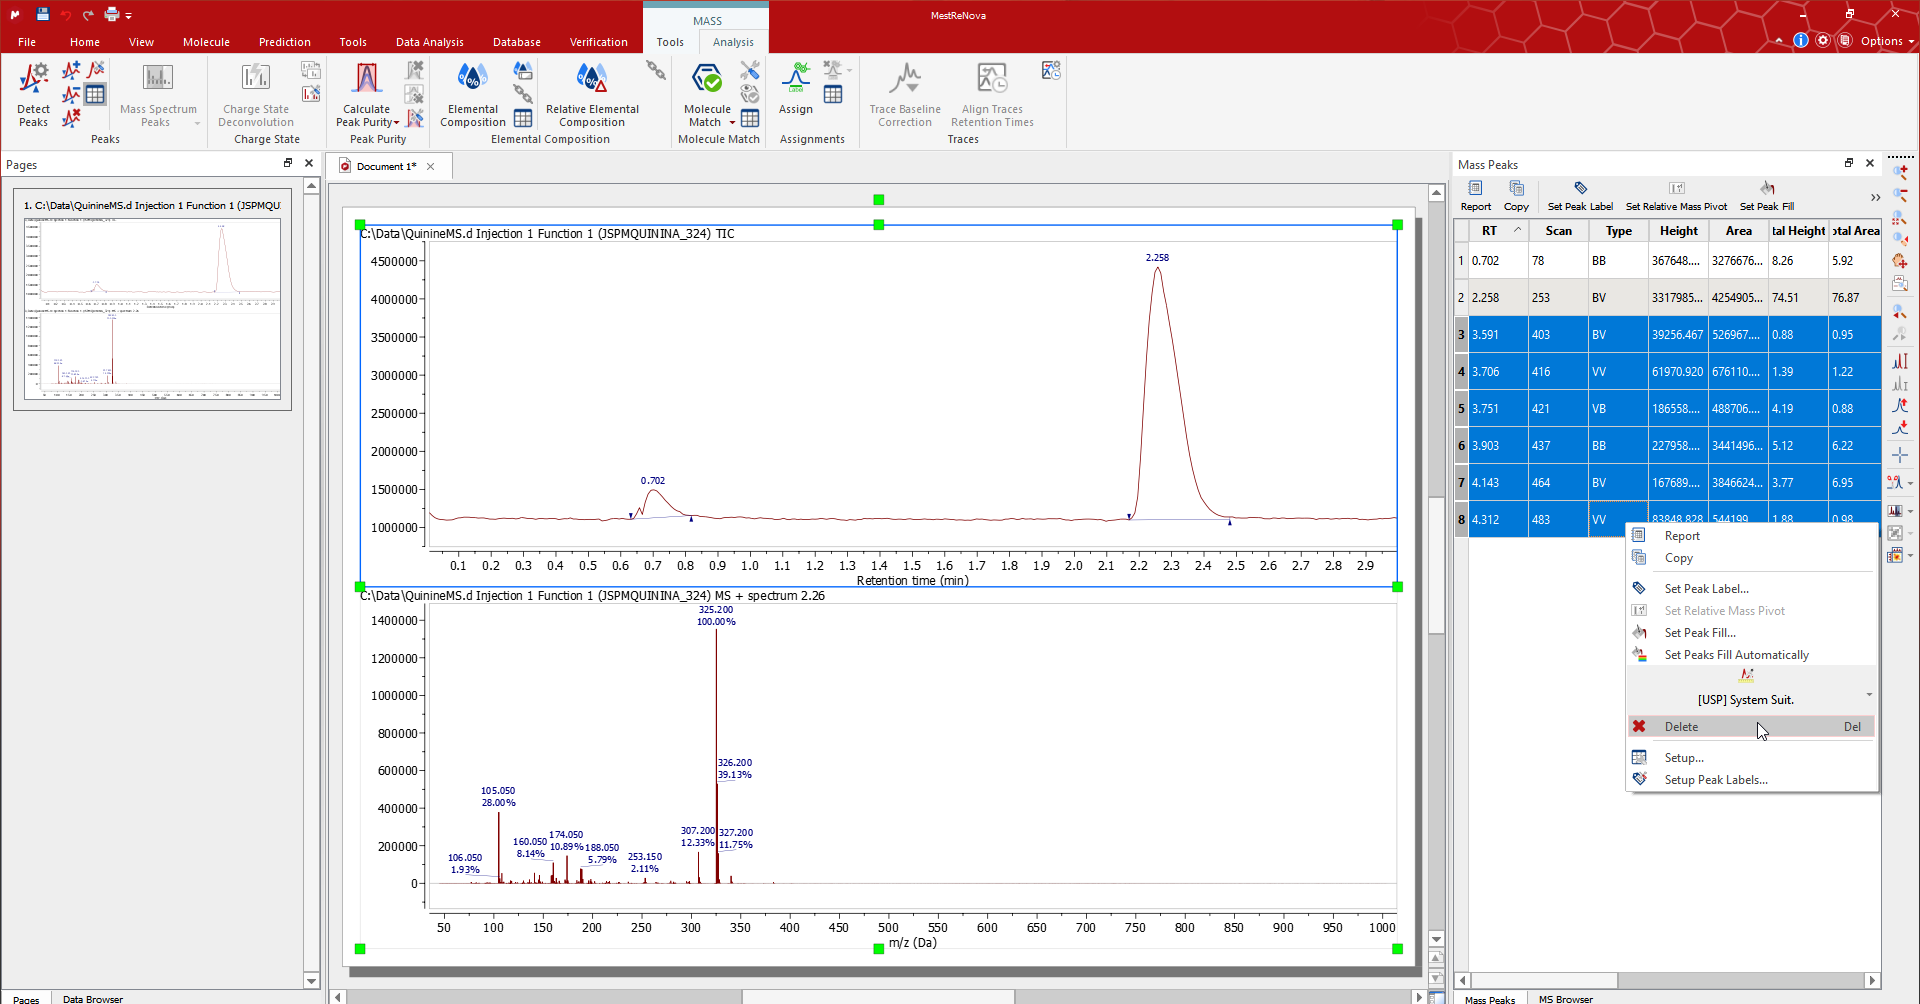
The peaks that Mnova automatically detects can be edited using the tools for the Peak group in the 'Mass/Analysis' ribbon or in the peak context menu (right click on the peak label).
Mnova 自动检测的峰可以通过 '质量/分析' 标签或峰上下文菜单(双击峰标签)使用峰组工具进行编辑。

The Mass Peaks table contains the details of the list of peaks for each plot. Edit/remove the peaks by selecting the associated rows in the table.
批量峰值表包含每个图的峰值列表的详细信息。通过选择表格中的相关行来编辑/删除峰值。
Select another mass spectrum at a particular retention time value or range with the 'Crosshair/Select' feature in the Mass/Tools ribbon.
选择特定保留时间值或范围内的另一个质谱,使用“十字线/选择”功能在质量/工具选项卡中。

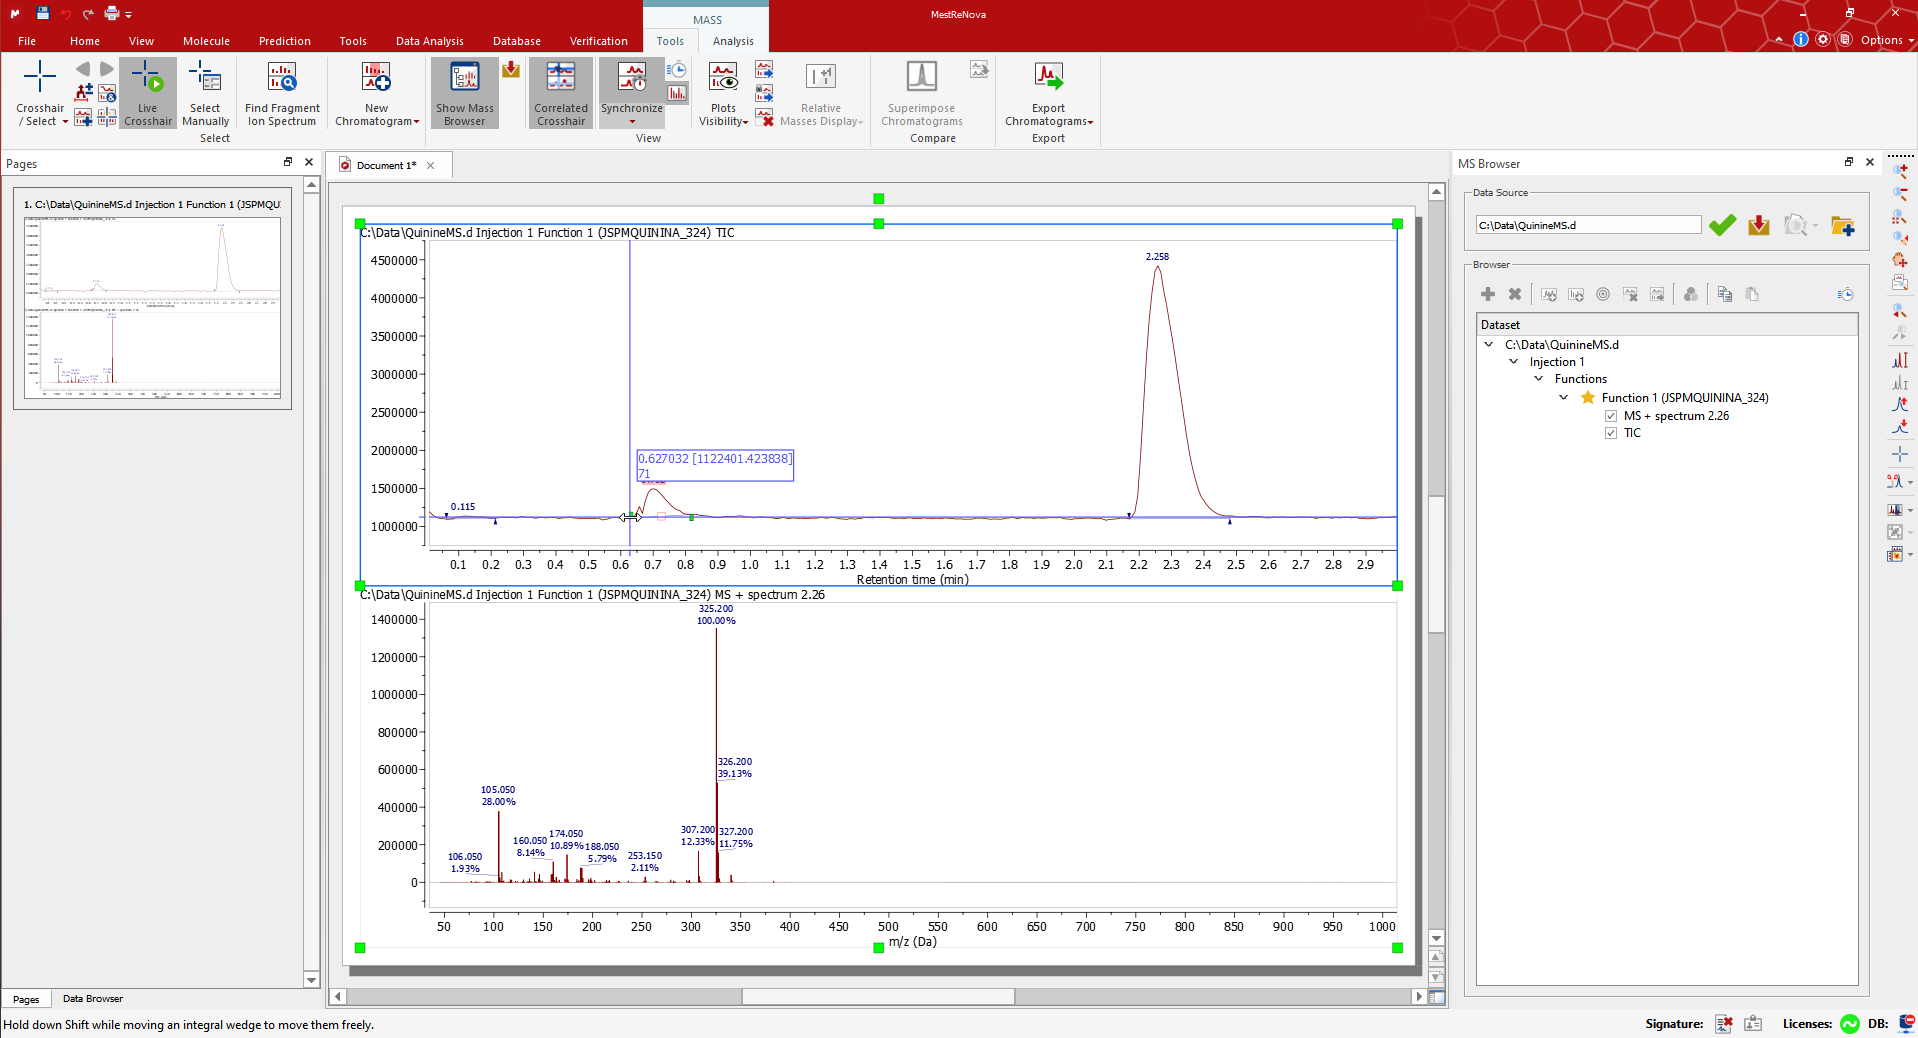
Switch to Crosshair/Select Manual: A preview of the MS is displayed when hovering the mouse over the TIC if 'Live Crosshair' is active. Click on the TIC to display the mass spectrum at the desired retention time. In this example, we have manually selected the spectrum at a retention time of 0.70 min.
切换到十字线/选择手动:如果“实时十字线”激活,则在将鼠标悬停在 TIC 上时显示 MS 预览。点击 TIC 以显示所需保留时间的质谱。在这个例子中,我们手动选择了保留时间为 0.70 分钟的谱图。

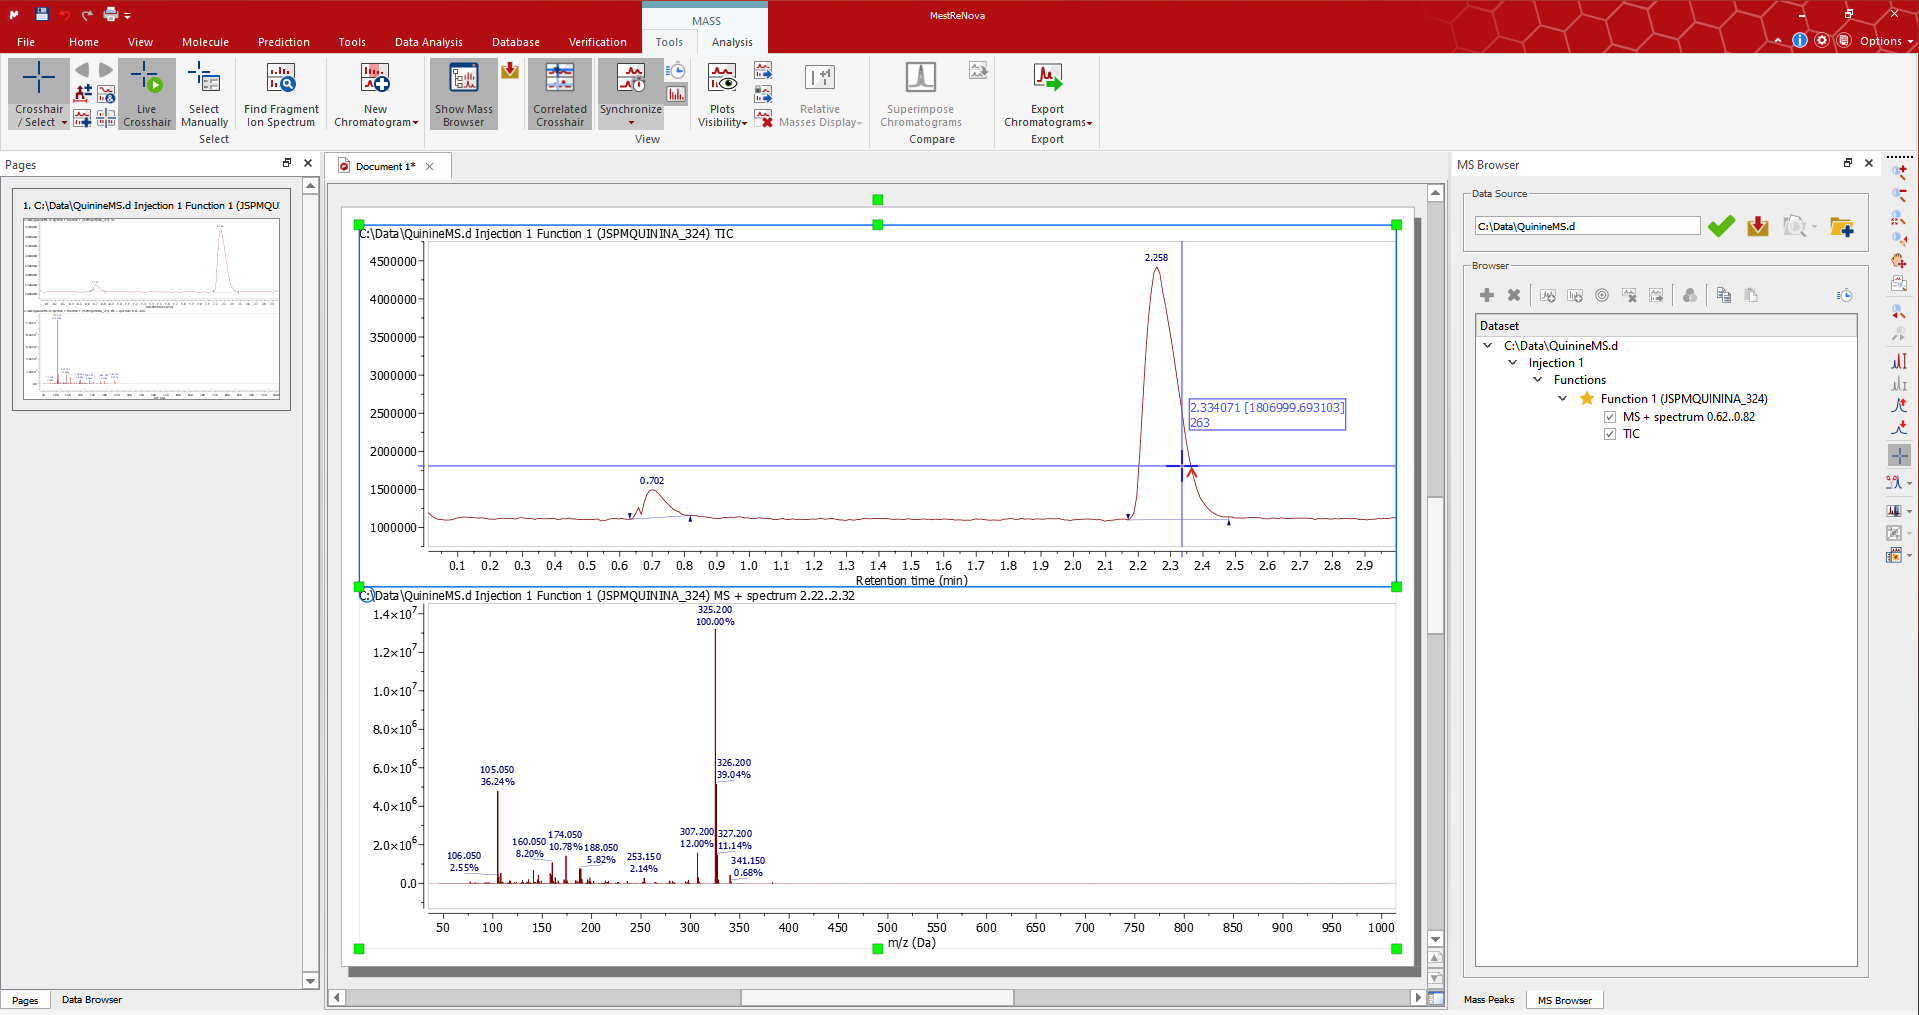
If you need to average the mass spectra over a certain time range (co-add), switch to Crosshair/Select Manual mode and click-and-drag on the TIC to display co-added spectra in the desired response time range. In this case, we co-add multiple mass spectra from 0.64 to 0.82 (the label at the top of the MS will inform you about the range of retention time).
如果需要在特定时间范围内平均质谱(共加),切换到 Crosshair/Select Manual 模式,点击并拖动 TIC 以显示所需响应时间范围内的共加质谱。在这种情况下,我们从 0.64 到 0.82 共加多个质谱(MS 顶部的标签将告知您保留时间的范围)。

The Crosshair/Select Peak mode allows you to co-add a whole peak. Click on a peak to display the co-added MS within the peak range.
交叉 hair/选择顶峰模式允许您将整个峰叠加。点击一个峰以显示峰范围内的叠加 MS。
The Crosshair/Select Peak (Background subtraction) mode displays the co-added MS within the peak range with the background subtracted.
交叉 hair/选择顶峰(背景减法)模式显示了在顶峰范围内通过减去背景得到的共加 MS。

Toggle on Appending mode to generate a new mass spectrum when using the Crosshair/Select tool.
切换到附加模式,使用十字线/选择工具时生成新的质谱。

For simplicity, let's undo all these changes and load the QuinineMS.d dataset again.
为了简化,让我们撤销所有这些更改并再次加载 QuinineMS.d 数据集。
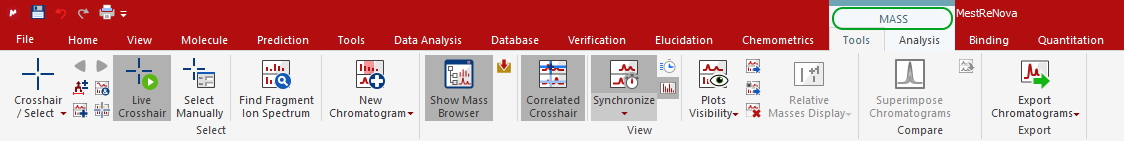
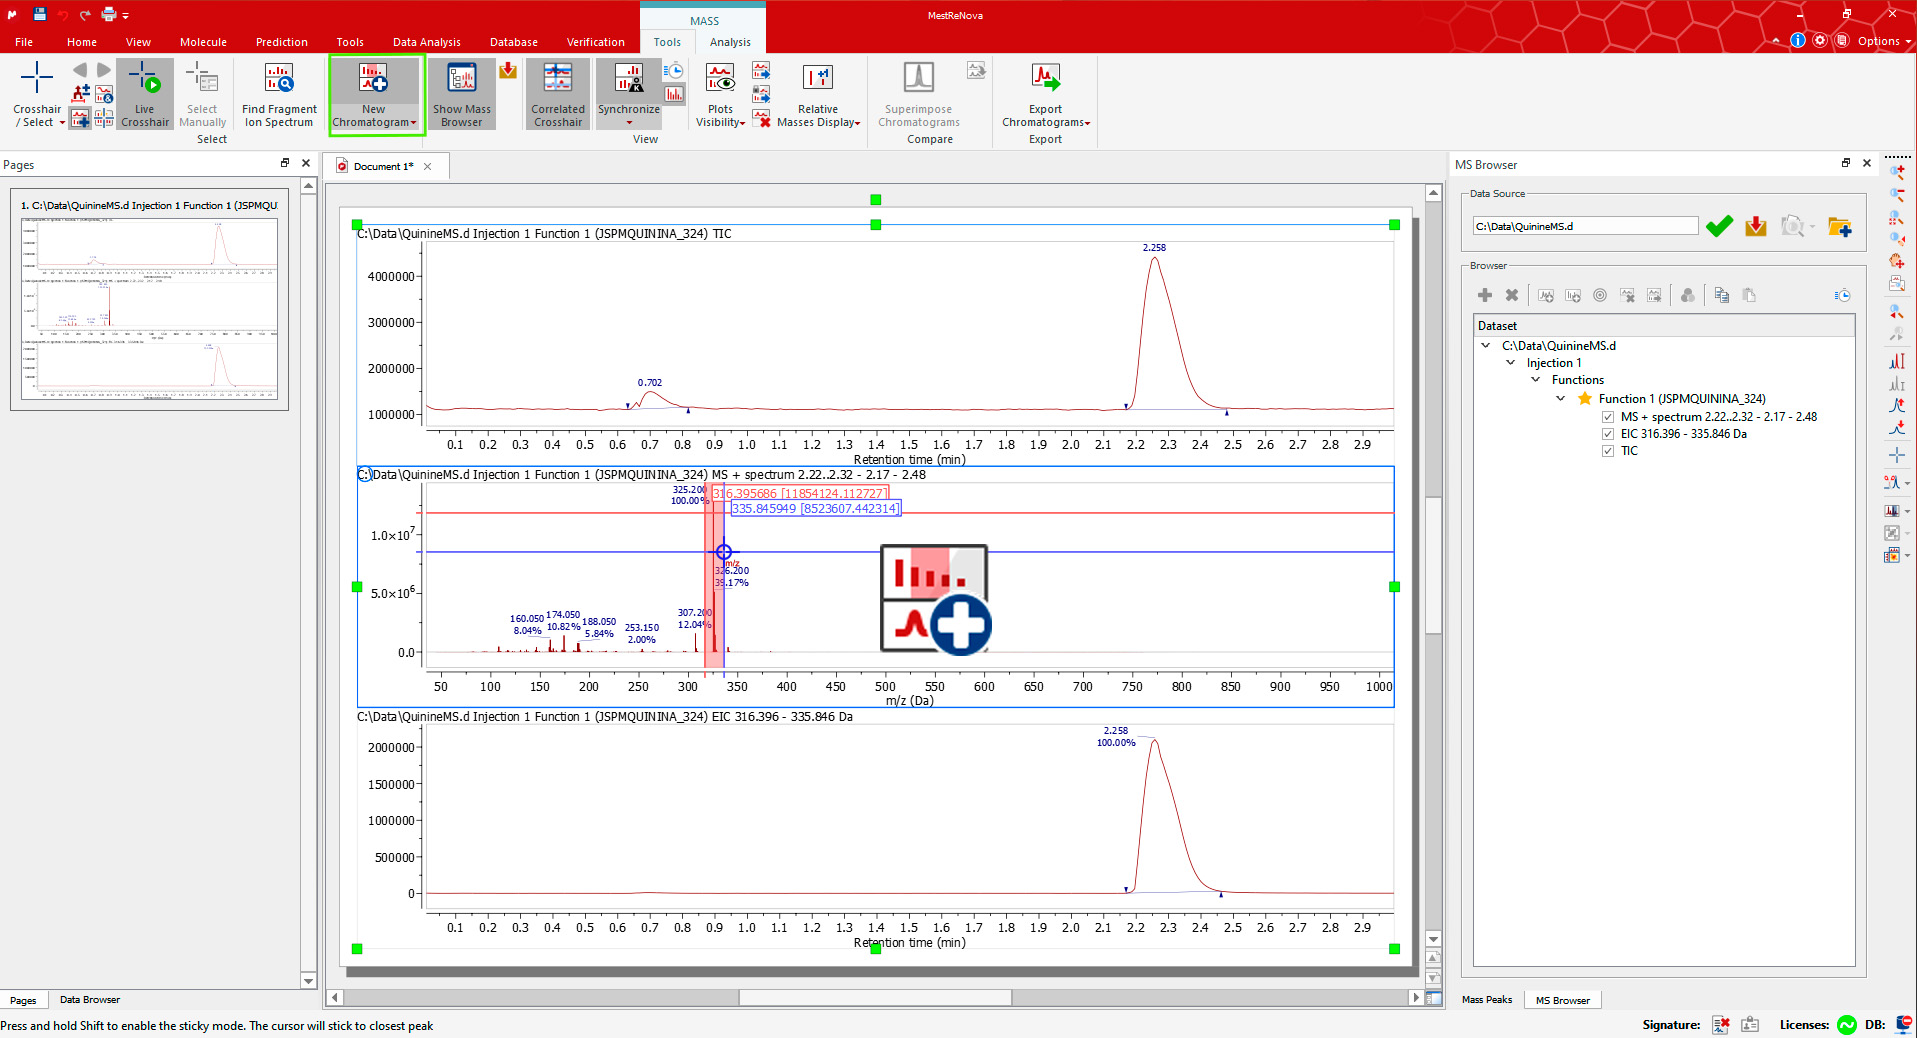
Display the Extracted Ion Chromatogram (EIC) for an MS peak using the New Chromatogram tool from the Mass/Tools ribbon. The cursor will be displayed in the mass spectrum plots. Select an m/z value or click-and-drag for a range. The corresponding EIC plot will be appended at the bottom.
使用“新色谱图”工具从“质谱/工具”标签栏中显示 MS 峰的提取离子色谱图(EIC)。光标将在质量谱图中显示。选择 m/z 值或点击并拖动以获取范围。相应的 EIC 图将被附加在底部。
Let's now reload the QuinineMS.d dataset.
让我们现在重新加载 QuinineMS.d 数据集。
The Molecule match analysis determines the possible presence of one or more given structures (or molecular formulae) within a mass spectral dataset. The isotope cluster for each structure is computed and compared to each spectrum in the dataset, and the mass spectrum with the best match that returns a score above the preset threshold is taken as a positive “match” or will otherwise be taken as "Not found".
分子匹配分析确定给定结构(或分子式)之一或更多存在于质谱数据集中的可能存在。为每个结构计算同位素簇,并将其与数据集中的每个谱图进行比较,返回的得分超过预设阈值的最佳匹配谱图被视为正向“匹配”,否则被视为“未找到”。
Open one or more structures in the current document. Click on the ‘Molecule Match’ button of the Mass/Analysis Calculate Molecule Match, and the Molecule Match table will be automatically displayed. This table contains the status of each structure or formula “matched” or “not found” - and other information such as Retention Time, Match Score, Adduct/Lose, etc.
打开当前文档中的一个或多个结构。点击“Molecule Match”按钮,Molecule Match 表格将自动显示。该表格包含每个结构或公式“匹配”或“未找到”的状态,以及其他信息,如保留时间、匹配分数、添加物/丢失等。

By clicking on any matched row in the table, the Matched Isotope Cluster Chromatogram for the corresponding molecule will be overlaid as a blue line in the TIC: it indicates where the best match is. The mass spectrum corresponding to that retention time (2.26 min in this case) is also displayed with the predicted isotope cluster overlaid on it (the blue shaded area plus blue peaks with 'whiskers').
通过点击表格中的任何匹配行,将对应分子的匹配同位素簇色谱图作为蓝色线条叠加在 TIC 上:这表示最佳匹配的位置。显示与该保留时间(本例中为 2.26 分钟)相对应的质量谱,其中预测的同位素簇叠加在其上(蓝色阴影区域加上带有“触须”的蓝色峰)。
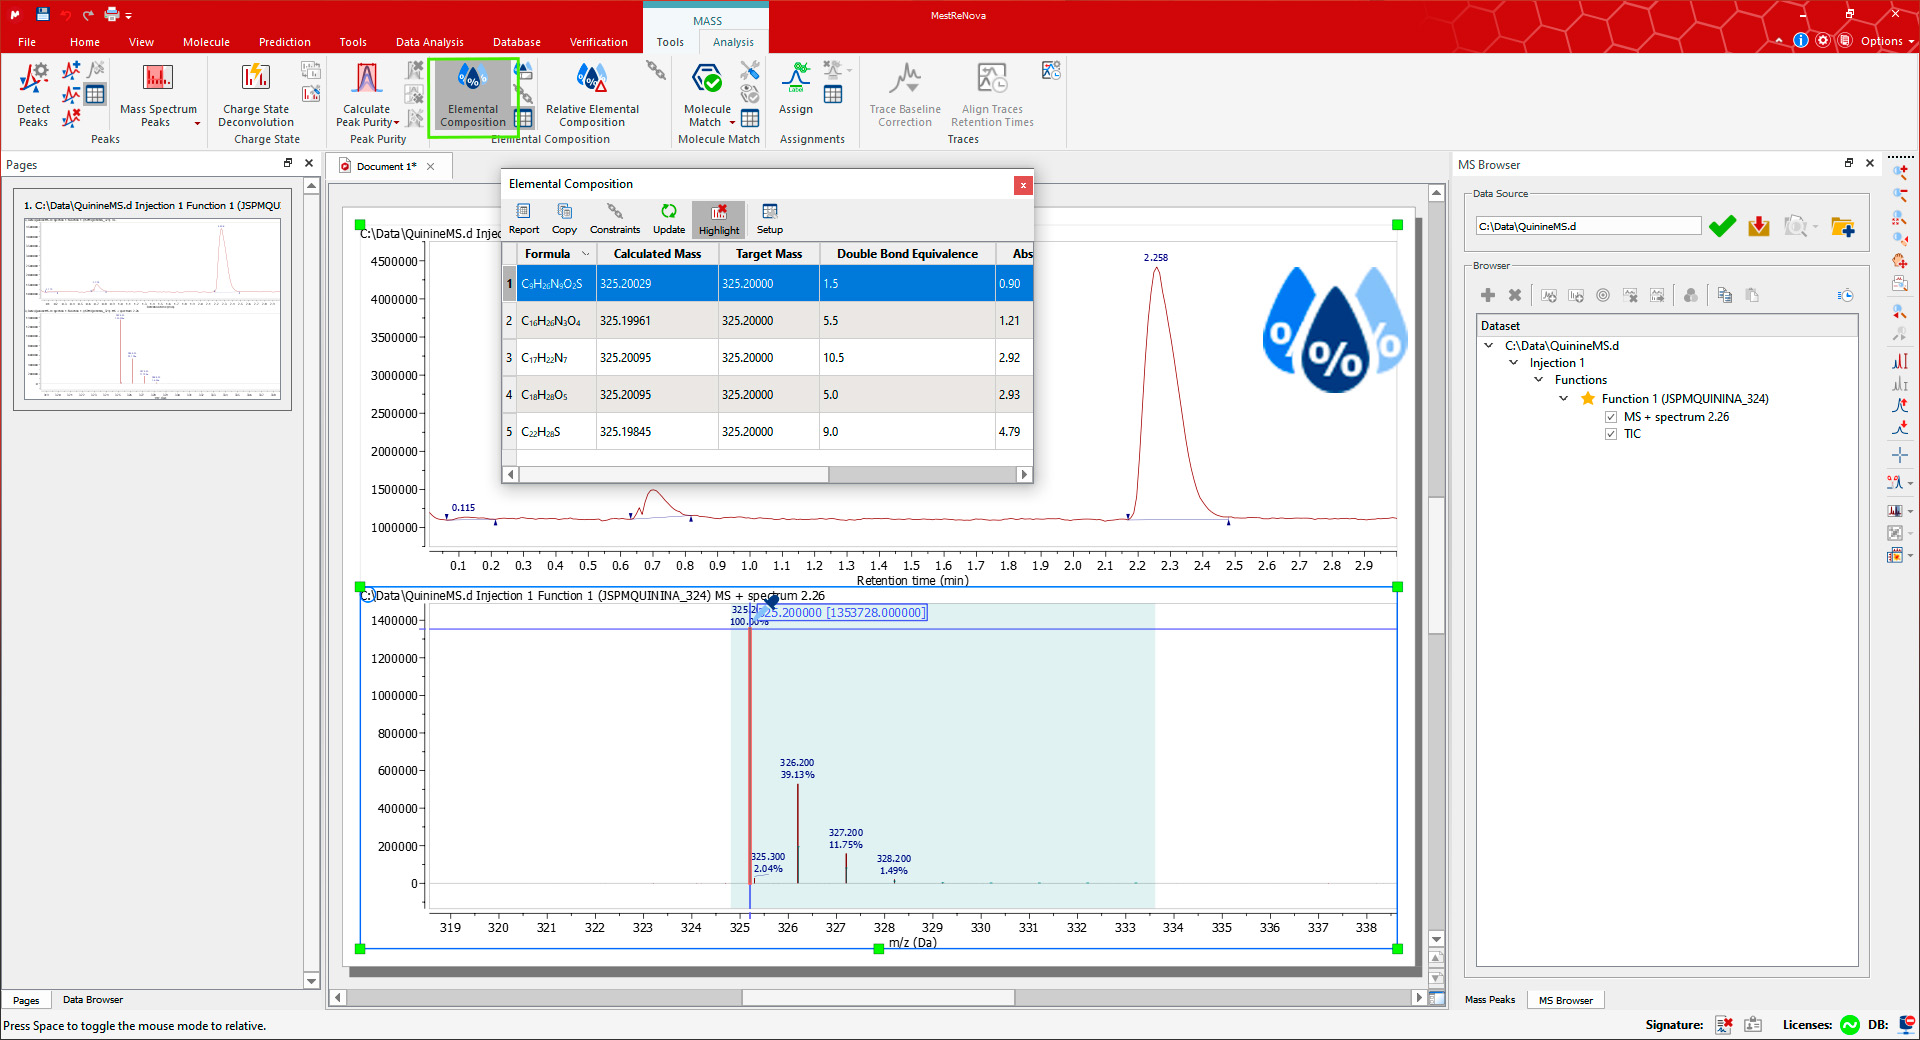
If you are using a high-resolution MS, it is possible to do an 'Elemental Composition' analysis of any peak in the mass spectrum. First, open the Elemental Composition Constraints dialog using the Constraints button on the Elemental Composition group in the Mass/Analysis toolbar.
如果使用高分辨率 MS,可以在质谱的任何峰上进行“元素组成”分析。首先,通过质谱/分析工具栏中“元素组成”组上的“约束”按钮打开“元素组成”约束对话框。

You can always add more 'Element Constraints' just by clicking on the highlighted 'Add' button. Once you have finished with the constraints, click on OK and go back to the MS spectrum to click on the desired MS peak with the Elemental Composition selection tool (which activates the cursor). The Elemental Composition table is automatically shown with the results on the selected mass peak.
你可以随时通过点击高亮的“添加”按钮来添加更多的“元素约束”。完成约束后,点击确定并返回 MS 谱,使用元素组成选择工具点击选定的质量峰。自动显示元素组成表格,显示在选择的质量峰上的结果。
You can predict the isotope cluster of a molecular formula with different adducts and losses using the highlighted tool 'Predict' located in the MS Prediction toolbar. Add or choose a molecular formula and click OK to simulate the isotope clusters with the predefined adducts/losses.
您可以使用高亮显示的工具 '预测',位于 MS 预测工具栏中,来预测具有不同附加物和损失的分子式中的同位素簇。添加或选择一个分子式并点击确定,以模拟预定义的同位素簇/损失。

The Mass Prediction table is shown. Click on the row with the desired Adduct or Loss and the prediction will be overlaid on the active mass spectrum to allow its comparison with the displayed mass spectrum.
质谱预测表显示。点击所需的基团或丢失的行,预测将叠加在活动质谱上,以便与显示的质谱进行比较。

Finally, you will be able to save, print, or export the document to PDF by clicking on the corresponding icon in the File menu.
最后,您可以通过文件菜单中相应的图标来保存、打印或以 PDF 格式导出文档。

You can check the following pages for MSChrom plugin features and resources and details about supported data formats.
您可以访问以下页面以了解 MSChrom 插件的功能、资源和受支持的数据格式的详细信息。
And once again, if you wish to read more information about how to use MSChrom in more detail please check out our manual that you can find on either of our downloads and Mnova pages.
再次,如果您想了解更多关于如何详细使用 MSChrom 的信息,请查看我们的手册,您可以在我们的下载或 Mnova 页面上找到。

